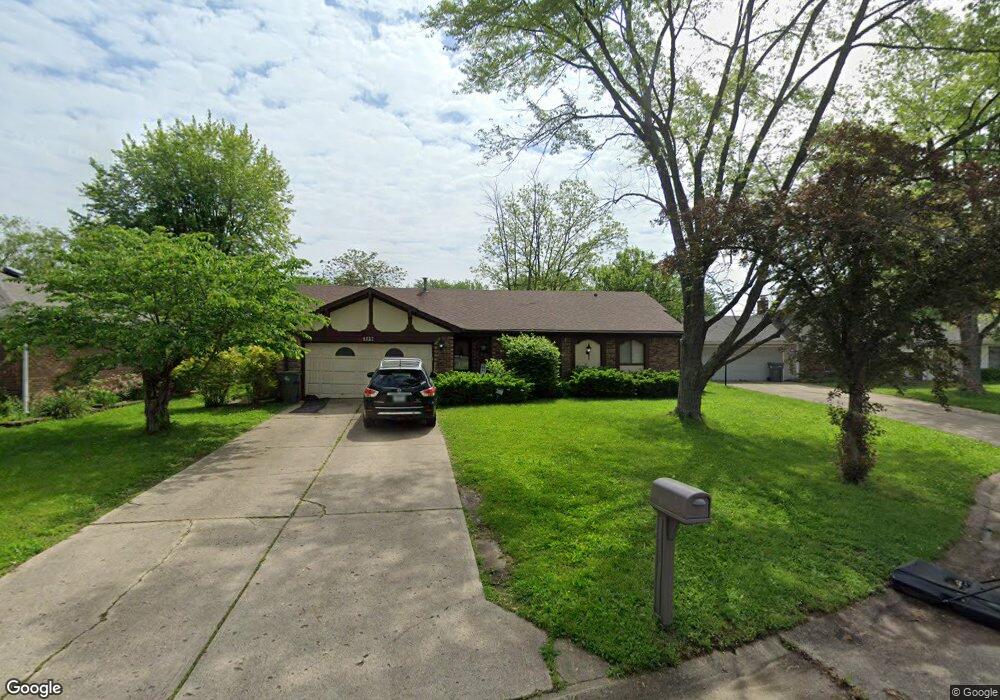
4927 Dancer Dr Indianapolis, IN 46237
South Emerson NeighborhoodEstimated Value: $228,000 - $244,000
3
Beds
2
Baths
1,362
Sq Ft
$172/Sq Ft
Est. Value
About This Home
This home is located at 4927 Dancer Dr, Indianapolis, IN 46237 and is currently estimated at $234,496, approximately $172 per square foot. 4927 Dancer Dr is a home located in Marion County with nearby schools including Franklin Central High School, Gray Road Christian School, and Indianapolis Southside Christian Academy.
Ownership History
Date
Name
Owned For
Owner Type
Purchase Details
Closed on
Aug 23, 2013
Sold by
Rees Gary S and Ruth L Altom Living Trust
Bought by
Robertson Rachel
Current Estimated Value
Home Financials for this Owner
Home Financials are based on the most recent Mortgage that was taken out on this home.
Original Mortgage
$3,940
Outstanding Balance
$2,896
Interest Rate
4.33%
Estimated Equity
$231,600
Create a Home Valuation Report for This Property
The Home Valuation Report is an in-depth analysis detailing your home's value as well as a comparison with similar homes in the area
Home Values in the Area
Average Home Value in this Area
Purchase History
| Date | Buyer | Sale Price | Title Company |
|---|---|---|---|
| Robertson Rachel | -- | -- |
Source: Public Records
Mortgage History
| Date | Status | Borrower | Loan Amount |
|---|---|---|---|
| Open | Robertson Rachel | $3,940 | |
| Open | Robertson Rachel | $96,715 |
Source: Public Records
Tax History
| Year | Tax Paid | Tax Assessment Tax Assessment Total Assessment is a certain percentage of the fair market value that is determined by local assessors to be the total taxable value of land and additions on the property. | Land | Improvement |
|---|---|---|---|---|
| 2024 | $1,883 | $188,300 | $24,500 | $163,800 |
| 2023 | $1,906 | $179,700 | $24,500 | $155,200 |
| 2022 | $1,951 | $173,000 | $24,500 | $148,500 |
| 2021 | $1,613 | $150,800 | $24,500 | $126,300 |
| 2020 | $1,469 | $136,600 | $24,500 | $112,100 |
| 2019 | $1,356 | $124,300 | $18,300 | $106,000 |
| 2018 | $1,287 | $117,700 | $18,300 | $99,400 |
| 2017 | $1,270 | $116,400 | $18,300 | $98,100 |
| 2016 | $1,219 | $111,500 | $18,300 | $93,200 |
| 2014 | $1,016 | $100,400 | $18,300 | $82,100 |
| 2013 | $436 | $94,700 | $18,300 | $76,400 |
Source: Public Records
Map
Nearby Homes
- 5102 Triple Crown Way
- 5106 Triple Crown Way
- 5110 Triple Crown Way
- 5103 Triple Crown Way
- 5115 Triple Crown Way
- 4930 Candy Spots Dr
- 5146 Triple Crown Way
- 5120 Pappas Dr
- 5107 Triple Crown Way
- Spring Valley Plan at Belmont
- Hickory Plan at Belmont
- New Castle Plan at Belmont
- 5223 Bahia Dr
- 5222 Triple Crown Way
- 5061 Modernist Blvd
- 5041 Rolling Meadow Blvd
- 5140 Rolling Meadow Blvd
- 5103 Rolling Meadow Blvd
- 5107 Rolling Meadow Blvd
- 5115 Rolling Meadow Blvd
- 4933 Dancer Dr
- 4915 Dancer Dr
- 4939 Dancer Dr
- 4907 Dancer Dr
- 4922 Dancer Dr
- 4940 Dancer Dr
- 4916 Dancer Dr
- 4934 Dancer Dr
- 4901 Dancer Dr
- 4910 Dancer Dr
- 4841 Dancer Dr
- 4906 Dancer Dr
- 4937 Carry Back Ln
- 4931 Carry Back Ln
- 4925 Carry Back Ln
- 5014 Parterra Ct
- 4835 Dancer Dr
- 4902 Dancer Dr
- 4917 Carry Back Ln
- 5004 Parterra Ct