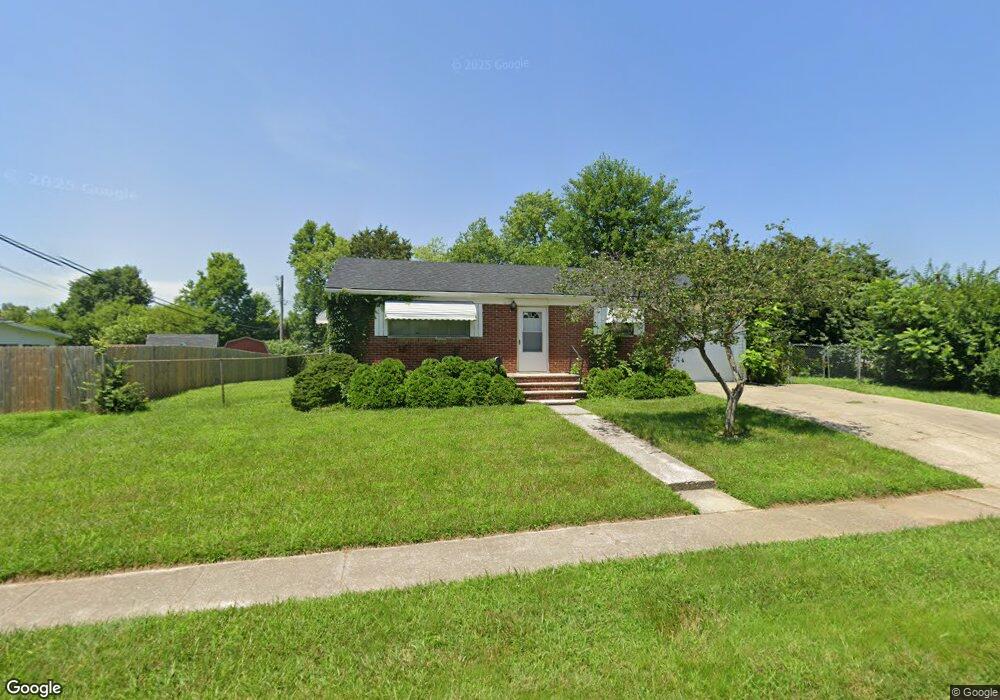
4927 Hackett Dr Dayton, OH 45417
Estimated Value: $89,000 - $111,754
3
Beds
2
Baths
945
Sq Ft
$107/Sq Ft
Est. Value
About This Home
This home is located at 4927 Hackett Dr, Dayton, OH 45417 and is currently estimated at $101,439, approximately $107 per square foot. 4927 Hackett Dr is a home located in Montgomery County with nearby schools including Blairwood Elementary School and Jefferson High School.
Ownership History
Date
Name
Owned For
Owner Type
Purchase Details
Closed on
Jan 25, 2019
Sold by
Deutsche Bank National Trust Company
Bought by
Ogletree Roy and Ogletree Lawrence
Current Estimated Value
Purchase Details
Closed on
Nov 21, 2018
Sold by
Floyd Isaac
Bought by
Deutsche Bank National Trust Co and New Century Home Equity Loan Trust
Purchase Details
Closed on
Apr 12, 2002
Sold by
Talley Ladon J
Bought by
Floyd Isaac
Home Financials for this Owner
Home Financials are based on the most recent Mortgage that was taken out on this home.
Original Mortgage
$68,400
Interest Rate
7.13%
Purchase Details
Closed on
Nov 9, 1999
Sold by
Dean Ladon J and Dean Ladon J
Bought by
Talley Ladon J
Home Financials for this Owner
Home Financials are based on the most recent Mortgage that was taken out on this home.
Original Mortgage
$19,770
Interest Rate
7.9%
Mortgage Type
Stand Alone Second
Purchase Details
Closed on
Sep 5, 1996
Sold by
Dean Stanley L
Bought by
Dean Ladon J
Create a Home Valuation Report for This Property
The Home Valuation Report is an in-depth analysis detailing your home's value as well as a comparison with similar homes in the area
Purchase History
| Date | Buyer | Sale Price | Title Company |
|---|---|---|---|
| Ogletree Roy | $30,000 | Vylla Title Llc | |
| Deutsche Bank National Trust Co | $25,900 | None Available | |
| Floyd Isaac | $72,000 | Scioto Title Agency Inc | |
| Talley Ladon J | -- | -- | |
| Dean Ladon J | -- | -- |
Source: Public Records
Mortgage History
| Date | Status | Borrower | Loan Amount |
|---|---|---|---|
| Previous Owner | Floyd Isaac | $68,400 | |
| Previous Owner | Talley Ladon J | $19,770 |
Source: Public Records
Tax History
| Year | Tax Paid | Tax Assessment Tax Assessment Total Assessment is a certain percentage of the fair market value that is determined by local assessors to be the total taxable value of land and additions on the property. | Land | Improvement |
|---|---|---|---|---|
| 2025 | $1,735 | $25,750 | $6,460 | $19,290 |
| 2024 | $1,689 | $25,750 | $6,460 | $19,290 |
| 2023 | $1,689 | $25,750 | $6,460 | $19,290 |
| 2022 | $1,440 | $18,130 | $4,550 | $13,580 |
| 2021 | $1,443 | $18,130 | $4,550 | $13,580 |
| 2020 | $1,442 | $18,130 | $4,550 | $13,580 |
| 2019 | $1,694 | $18,050 | $3,150 | $14,900 |
| 2018 | $1,413 | $18,050 | $3,150 | $14,900 |
| 2017 | $1,403 | $18,050 | $3,150 | $14,900 |
| 2016 | $1,675 | $19,020 | $3,500 | $15,520 |
| 2015 | $1,285 | $19,020 | $3,500 | $15,520 |
| 2014 | $1,285 | $19,020 | $3,500 | $15,520 |
| 2012 | -- | $24,720 | $3,500 | $21,220 |
Source: Public Records
Map
Nearby Homes
- 5109 Fortman Dr
- 1692 Hopewell Ave
- 5037 Retford Dr
- 4750 Coulson Dr
- 1107 Rossiter Dr
- 2250 Infirmary Rd
- 1708 S Gettysburg Ave
- 2622 Soldiers Home-West Carrollton Rd
- 3942 Alvin Ave
- 12 Jenkins Dr
- 137 Bluecrest Ave
- 5216 W Third St
- 6925 W Third St
- 2932 Sage Ave
- 2923 Sage Ave
- 3032 Germantown St
- 0 Infirmary Rd Unit 953331
- 72 Patton Ave
- 154 Pomeroy Ave
- 144 Pomeroy Ave
- 4947 Hackett Dr
- 4950 Derby Rd
- 4907 Hackett Dr
- 4960 Derby Rd
- 4987 Fortman Dr
- 4932 Hackett Dr
- 4970 Derby Rd
- 4922 Hackett Dr
- 4942 Hackett Dr
- 4999 Fortman Dr
- 4912 Hackett Dr
- 4952 Hackett Dr
- 4978 Derby Rd
- 4982 Fortman Dr
- 4902 Hackett Dr
- 4962 Hackett Dr
- 5013 Fortman Dr
- 4988 Derby Rd
- 4883 Germantown Pike
- 4903 Germantown Pike
Your Personal Tour Guide
Ask me questions while you tour the home.