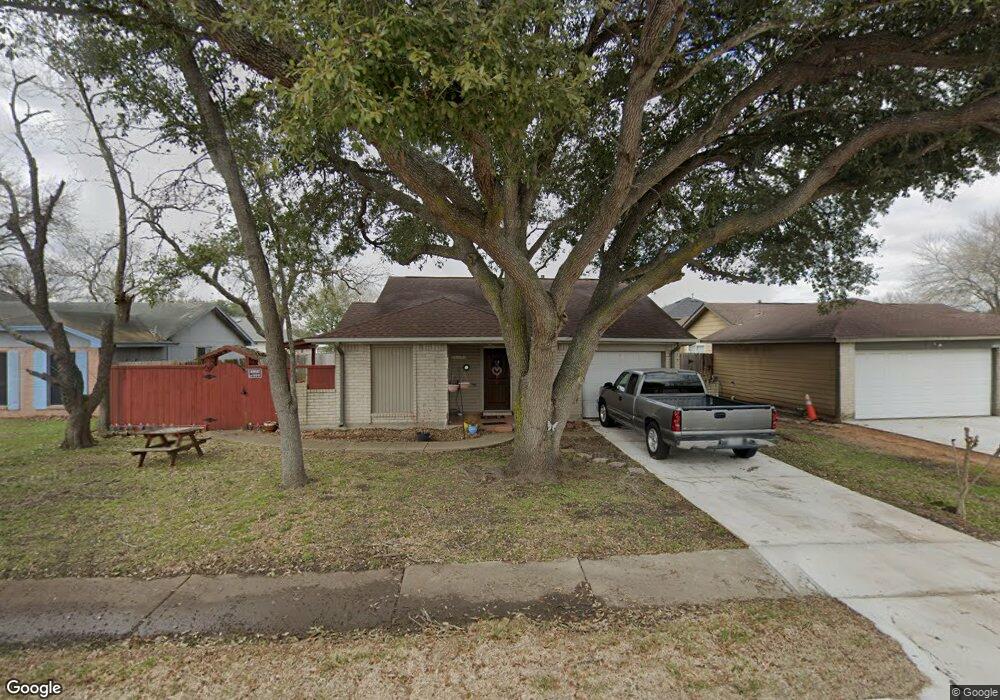
4927 Riverwood Dr Richmond, TX 77469
Estimated Value: $165,347 - $199,000
2
Beds
1
Bath
1,062
Sq Ft
$175/Sq Ft
Est. Value
About This Home
This home is located at 4927 Riverwood Dr, Richmond, TX 77469 and is currently estimated at $185,337, approximately $174 per square foot. 4927 Riverwood Dr is a home located in Fort Bend County with nearby schools including J J Wessendorff Middle School, Lamar Junior High School, and Lamar Consolidated High School.
Ownership History
Date
Name
Owned For
Owner Type
Purchase Details
Closed on
Aug 18, 2016
Sold by
Rodriguez Noel Osvaldo and Rodriguez Maria
Bought by
Rodriguez Maria
Current Estimated Value
Purchase Details
Closed on
May 11, 2006
Sold by
Monge Guadalupe Susana
Bought by
Rodriguez Noel Osvaldo and Rodriguez Maria
Home Financials for this Owner
Home Financials are based on the most recent Mortgage that was taken out on this home.
Original Mortgage
$48,000
Interest Rate
6.5%
Mortgage Type
Fannie Mae Freddie Mac
Purchase Details
Closed on
Oct 1, 1999
Sold by
Monge Doroteo
Bought by
Monge Guadalupe Susana
Purchase Details
Closed on
Jun 8, 1990
Sold by
Gibraltar Savings
Bought by
Rodriguez Maria
Create a Home Valuation Report for This Property
The Home Valuation Report is an in-depth analysis detailing your home's value as well as a comparison with similar homes in the area
Home Values in the Area
Average Home Value in this Area
Purchase History
| Date | Buyer | Sale Price | Title Company |
|---|---|---|---|
| Rodriguez Maria | -- | -- | |
| Rodriguez Noel Osvaldo | -- | Fidelity National Title | |
| Monge Guadalupe Susana | -- | -- | |
| Rodriguez Maria | -- | -- |
Source: Public Records
Mortgage History
| Date | Status | Borrower | Loan Amount |
|---|---|---|---|
| Previous Owner | Rodriguez Noel Osvaldo | $48,000 | |
| Closed | Monge Guadalupe Susana | $0 |
Source: Public Records
Tax History Compared to Growth
Tax History
| Year | Tax Paid | Tax Assessment Tax Assessment Total Assessment is a certain percentage of the fair market value that is determined by local assessors to be the total taxable value of land and additions on the property. | Land | Improvement |
|---|---|---|---|---|
| 2025 | $1,526 | $137,759 | $39,000 | $104,054 |
| 2024 | $1,526 | $125,235 | $24,057 | $101,178 |
| 2023 | $1,356 | $113,850 | $26,917 | $86,933 |
| 2022 | $1,907 | $103,500 | $8,460 | $95,040 |
| 2021 | $2,347 | $94,090 | $30,000 | $64,090 |
| 2020 | $2,286 | $85,540 | $20,000 | $65,540 |
| 2019 | $2,471 | $80,910 | $20,000 | $60,910 |
| 2018 | $2,304 | $74,090 | $20,000 | $54,090 |
| 2017 | $2,014 | $64,260 | $12,000 | $52,260 |
| 2016 | $1,737 | $55,430 | $12,000 | $43,430 |
| 2015 | $549 | $50,390 | $12,000 | $38,390 |
| 2014 | $577 | $44,000 | $12,000 | $32,000 |
Source: Public Records
Map
Nearby Homes
- 5002 Quebec Blvd
- 5027 Quebec Blvd
- 4602 Avenue H
- 5303 Rivers Edge Dr
- 5319 Rivers Edge Dr
- 1109 Frances Dr
- 1806 Cedar Dr
- 1809 Hawthorn Dr
- 3724 Avenue F
- 3710 Avenue F
- 1805 Hawthorn Dr
- 1504 Radio Ln
- 221 Rochelle St
- 919 Aurelia Ln
- 1205 Preston St
- 1010 Aurelia Ln
- 0 Collins Rd Unit 57997814
- 4707 E Parma Dr
- 1716 Maiden Ln
- 6219 Deep Gulch Dr
- 4923 Riverwood Dr
- 4931 Riverwood Dr
- 4919 Riverwood Dr
- 5003 Riverwood Dr
- 5002 Winnipeg Blvd
- 4922 Winnipeg Blvd
- 0 Winnipeg
- 4926 Riverwood Dr
- 4922 Riverwood Dr
- 5007 Riverwood Dr
- 4915 Riverwood Dr
- 4918 Winnipeg Blvd
- 5006 Winnipeg Blvd
- 4930 Riverwood Dr
- 4918 Riverwood Dr
- 4930 Winnipeg Blvd
- 4914 Winnipeg Blvd
- 5010 Winnipeg Blvd
- 4914 Riverwood Dr
- 5011 Riverwood Dr