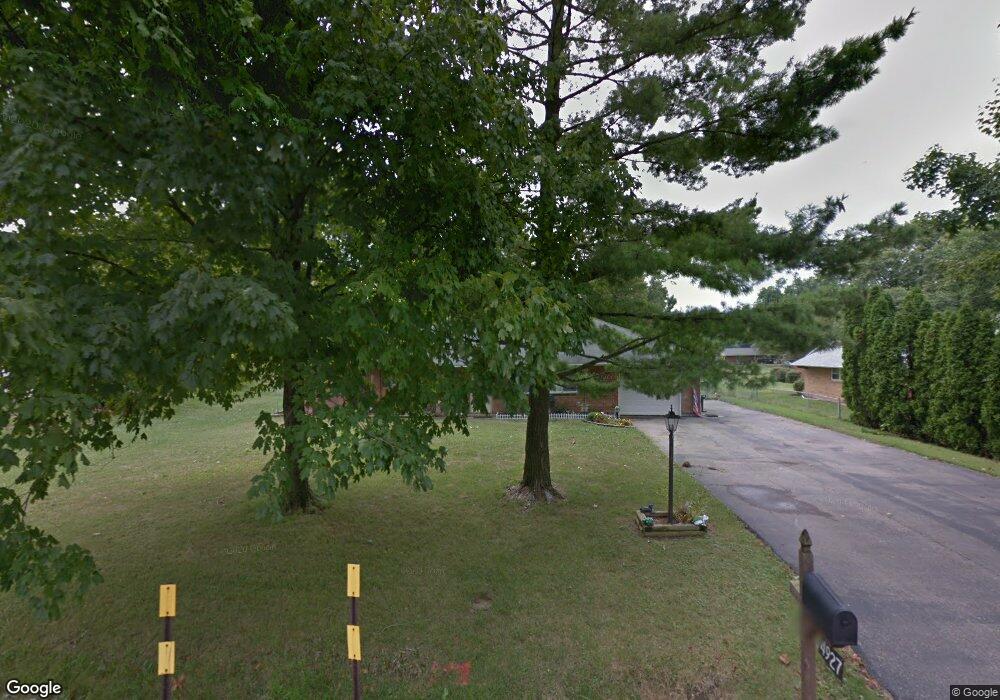
4927 Todd Rd Franklin, OH 45005
Estimated Value: $244,510 - $258,000
3
Beds
2
Baths
1,144
Sq Ft
$218/Sq Ft
Est. Value
About This Home
This home is located at 4927 Todd Rd, Franklin, OH 45005 and is currently estimated at $249,628, approximately $218 per square foot. 4927 Todd Rd is a home located in Warren County with nearby schools including Franklin High School, Summit Academy Community School for Alternative Learners - Middletown, and Marshall High School.
Ownership History
Date
Name
Owned For
Owner Type
Purchase Details
Closed on
Jul 14, 2003
Sold by
Leach Jason Todd and Leach Melissa Gayle
Bought by
South Barney E and South Pamela S
Current Estimated Value
Home Financials for this Owner
Home Financials are based on the most recent Mortgage that was taken out on this home.
Original Mortgage
$120,000
Outstanding Balance
$59,411
Interest Rate
7.99%
Mortgage Type
Purchase Money Mortgage
Estimated Equity
$190,217
Purchase Details
Closed on
Dec 3, 1991
Sold by
Jody K Foster & Trustee
Bought by
Leach and Jason Todd
Purchase Details
Closed on
Jul 17, 1991
Sold by
Roberts George C and Roberts Tere
Bought by
Jody K. Foster & Trustee
Purchase Details
Closed on
Jun 3, 1983
Sold by
Price Ronnie Lee and Price Paula
Bought by
Roberts and Roberts George C
Purchase Details
Closed on
Nov 7, 1980
Sold by
Hedric Hedric and Hedric Orville G
Create a Home Valuation Report for This Property
The Home Valuation Report is an in-depth analysis detailing your home's value as well as a comparison with similar homes in the area
Home Values in the Area
Average Home Value in this Area
Purchase History
| Date | Buyer | Sale Price | Title Company |
|---|---|---|---|
| South Barney E | $120,000 | Homesite Title Agency Inc | |
| Leach | $67,000 | -- | |
| Jody K. Foster & Trustee | $58,900 | -- | |
| Roberts | $49,900 | -- | |
| -- | $55,800 | -- |
Source: Public Records
Mortgage History
| Date | Status | Borrower | Loan Amount |
|---|---|---|---|
| Open | South Barney E | $120,000 |
Source: Public Records
Tax History
| Year | Tax Paid | Tax Assessment Tax Assessment Total Assessment is a certain percentage of the fair market value that is determined by local assessors to be the total taxable value of land and additions on the property. | Land | Improvement |
|---|---|---|---|---|
| 2025 | $2,622 | $59,470 | $16,010 | $43,460 |
| 2024 | $2,622 | $59,470 | $16,010 | $43,460 |
| 2023 | $2,362 | $48,219 | $13,132 | $35,087 |
| 2022 | $2,609 | $48,220 | $13,132 | $35,088 |
| 2021 | $2,574 | $48,220 | $13,132 | $35,088 |
| 2020 | $2,415 | $39,200 | $10,675 | $28,525 |
| 2019 | $2,214 | $39,200 | $10,675 | $28,525 |
| 2018 | $1,813 | $39,200 | $10,675 | $28,525 |
| 2017 | $2,105 | $33,527 | $9,261 | $24,266 |
| 2016 | $2,144 | $33,527 | $9,261 | $24,266 |
| 2015 | $2,147 | $33,527 | $9,261 | $24,266 |
| 2014 | $1,706 | $31,930 | $8,820 | $23,110 |
| 2013 | $1,449 | $38,650 | $10,680 | $27,970 |
Source: Public Records
Map
Nearby Homes
- 5019 Betsy Dr
- 3635 Julie Dr
- 3833 Sterling Dr
- 4689 Fisher Rd
- 5100 Renaissance Park Dr
- 5139 Renaissance Park Dr
- 3466 Renaissance Ct
- 4385 Harvest Ln
- 5284 Othello Dr
- 5302 Othello Dr
- 4458 Rose Marie Rd
- 5482 Sheldon Close
- 5455 Sheldon Close
- 5200 Long Meadow Dr
- 5371 Sheldon Close
- 3048 Canvasback Ct
- 3644 Connie Dr
- 3412 State Route 122
- 3545 Robinson Vail Rd
- 4640 Shaker Rd
Your Personal Tour Guide
Ask me questions while you tour the home.