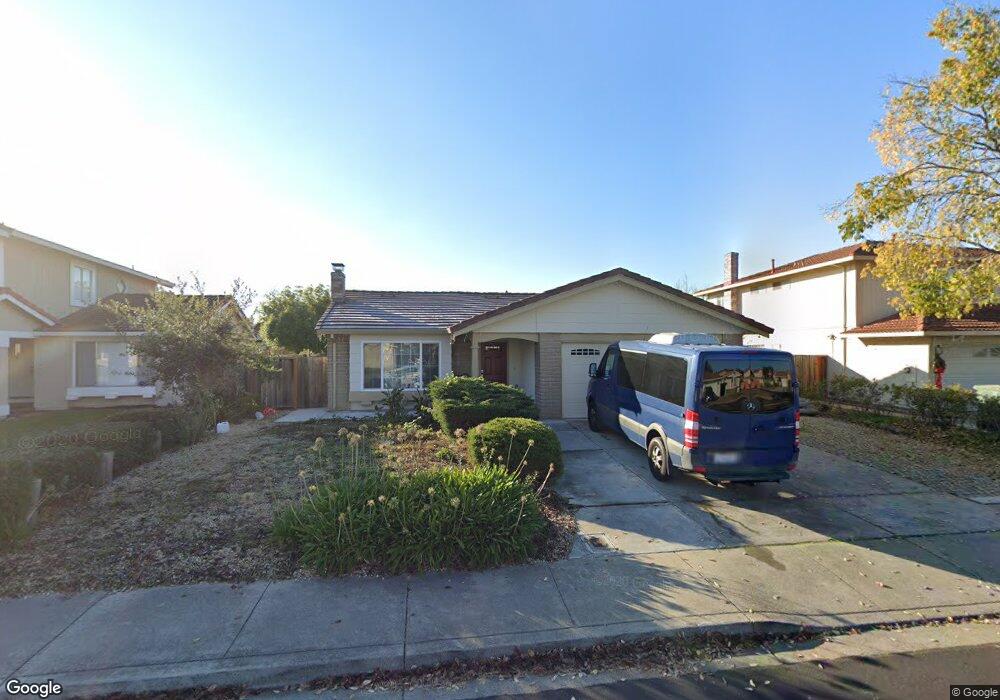
4928 Colusa St Union City, CA 94587
Alvarado NeighborhoodEstimated Value: $1,158,000 - $1,598,000
5
Beds
3
Baths
1,839
Sq Ft
$743/Sq Ft
Est. Value
About This Home
This home is located at 4928 Colusa St, Union City, CA 94587 and is currently estimated at $1,365,767, approximately $742 per square foot. 4928 Colusa St is a home located in Alameda County with nearby schools including Pioneer Elementary School, Itliong-Vera Cruz, and James Logan High School.
Ownership History
Date
Name
Owned For
Owner Type
Purchase Details
Closed on
Aug 26, 2009
Sold by
Kuo Eric and Kuo Kuang Tao
Bought by
Kuo Eric and Liao Kuei Mei
Current Estimated Value
Home Financials for this Owner
Home Financials are based on the most recent Mortgage that was taken out on this home.
Original Mortgage
$195,700
Outstanding Balance
$127,987
Interest Rate
5.19%
Mortgage Type
New Conventional
Estimated Equity
$1,237,780
Purchase Details
Closed on
Jan 8, 2002
Sold by
Liao Kuei Mei
Bought by
Kuo Kuang Tao
Home Financials for this Owner
Home Financials are based on the most recent Mortgage that was taken out on this home.
Original Mortgage
$215,000
Interest Rate
7.11%
Purchase Details
Closed on
Jun 8, 1999
Sold by
Abella Lloyd B and Abella Jenie M
Bought by
Kuo Kuang Tao
Home Financials for this Owner
Home Financials are based on the most recent Mortgage that was taken out on this home.
Original Mortgage
$210,000
Interest Rate
7%
Purchase Details
Closed on
Nov 9, 1997
Sold by
Napole Abella Lloyd B and Napole Jenie M Aquino
Bought by
Abella Lloyd B and Abella Jenie M
Create a Home Valuation Report for This Property
The Home Valuation Report is an in-depth analysis detailing your home's value as well as a comparison with similar homes in the area
Home Values in the Area
Average Home Value in this Area
Purchase History
| Date | Buyer | Sale Price | Title Company |
|---|---|---|---|
| Kuo Eric | -- | Fidelity National Title Co | |
| Kuo Kuang Tao | -- | Fidelity National Title Co | |
| Kuo Kuang Tao | $291,000 | Chicago Title Co | |
| Abella Lloyd B | -- | -- |
Source: Public Records
Mortgage History
| Date | Status | Borrower | Loan Amount |
|---|---|---|---|
| Open | Kuo Eric | $195,700 | |
| Closed | Kuo Kuang Tao | $215,000 | |
| Closed | Kuo Kuang Tao | $210,000 |
Source: Public Records
Tax History Compared to Growth
Tax History
| Year | Tax Paid | Tax Assessment Tax Assessment Total Assessment is a certain percentage of the fair market value that is determined by local assessors to be the total taxable value of land and additions on the property. | Land | Improvement |
|---|---|---|---|---|
| 2025 | $7,887 | $522,725 | $136,853 | $392,872 |
| 2024 | $7,887 | $512,341 | $134,170 | $385,171 |
| 2023 | $7,605 | $509,160 | $131,540 | $377,620 |
| 2022 | $7,484 | $492,177 | $128,961 | $370,216 |
| 2021 | $7,289 | $482,392 | $126,433 | $362,959 |
| 2020 | $7,285 | $484,373 | $125,136 | $359,237 |
| 2019 | $7,236 | $474,878 | $122,683 | $352,195 |
| 2018 | $7,060 | $465,569 | $120,278 | $345,291 |
| 2017 | $6,910 | $456,442 | $117,920 | $338,522 |
| 2016 | $6,751 | $447,493 | $115,608 | $331,885 |
| 2015 | $6,665 | $440,773 | $113,872 | $326,901 |
| 2014 | $6,388 | $432,138 | $111,641 | $320,497 |
Source: Public Records
Map
Nearby Homes
- 33064 Compton Ct
- 32945 Regents Blvd
- 4611 Carmen Way
- 4639 Michelle Ct
- 34102 Zaner Way
- 4532 Delores Dr
- 32409 Elizabeth Way
- 32451 Regents Blvd
- 34192 Firenze Terrace
- 5621 Via Lugano
- 34198 Tony Terrace
- 4506 Birchwood Ct
- 4231 Hanford St
- 4272 Warbler Loop
- 32447 Pacific Grove Way
- 5301 Shamrock Common
- 4243 Comet Cir
- 4201 Saturn Way
- 6004 Pisa Terrace Unit 119
- 6003 Milano Terrace Unit 14
- 4926 Colusa St
- 4930 Colusa St
- 4935 Caspar St
- 4933 Caspar St
- 4924 Colusa St
- 4937 Caspar St
- 4931 Caspar St
- 4925 Colusa St
- 4923 Colusa St
- 4922 Colusa St
- 4929 Caspar St
- 4921 Colusa St
- 4919 Calistoga St
- 4923 Calistoga St
- 4915 Calistoga St
- 4919 Colusa St
- 4927 Caspar St
- 4920 Colusa St
- 4927 Calistoga St
- 4911 Calistoga St