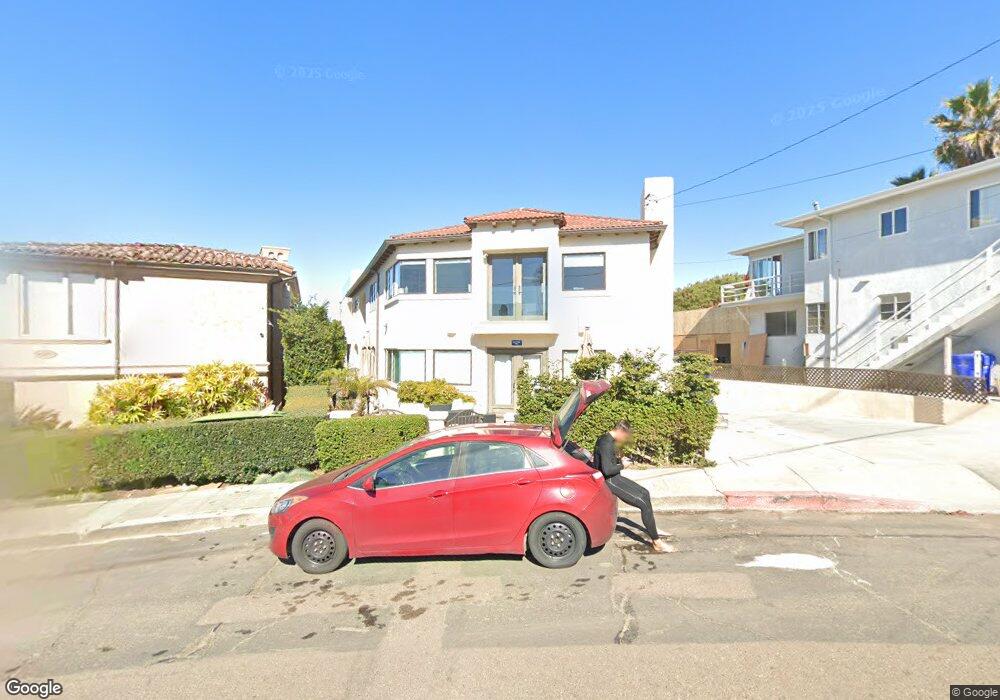
4928 Crystal Dr San Diego, CA 92109
Pacific Beach NeighborhoodEstimated Value: $4,814,000 - $5,993,000
6
Beds
5
Baths
4,227
Sq Ft
$1,284/Sq Ft
Est. Value
About This Home
This home is located at 4928 Crystal Dr, San Diego, CA 92109 and is currently estimated at $5,426,724, approximately $1,283 per square foot. 4928 Crystal Dr is a home located in San Diego County with nearby schools including Bird Rock Elementary School, Muirlands Middle School, and La Jolla High School.
Ownership History
Date
Name
Owned For
Owner Type
Purchase Details
Closed on
Feb 2, 2018
Sold by
Singer Nathaniel R and Singer Andrea D
Bought by
Hirschfield Marc and Morrow Anise
Current Estimated Value
Purchase Details
Closed on
Jan 9, 2008
Sold by
Vargo John D and Vargo Danielle N
Bought by
Singer Nathaniel R and Singer Andrea D
Purchase Details
Closed on
Oct 1, 2007
Sold by
Vargo John D and Vargo Danielle N
Bought by
Vargo John D and Vargo Danielle N
Purchase Details
Closed on
Mar 6, 2006
Sold by
Vargo John D and Vargo Danielle N
Bought by
Vargo John D and Vargo Danielle N
Purchase Details
Closed on
Oct 13, 2005
Sold by
Stam Nicholas James
Bought by
Evans William D and Evans Karen M
Home Financials for this Owner
Home Financials are based on the most recent Mortgage that was taken out on this home.
Original Mortgage
$955,800
Interest Rate
5.74%
Mortgage Type
Fannie Mae Freddie Mac
Purchase Details
Closed on
Nov 18, 2002
Sold by
Stam Ruth C
Bought by
Stam Ruth C
Create a Home Valuation Report for This Property
The Home Valuation Report is an in-depth analysis detailing your home's value as well as a comparison with similar homes in the area
Home Values in the Area
Average Home Value in this Area
Purchase History
| Date | Buyer | Sale Price | Title Company |
|---|---|---|---|
| Hirschfield Marc | $4,385,000 | Chicago Title Company Sd | |
| Singer Nathaniel R | $2,980,000 | Fidelity National Title Co | |
| Vargo John D | -- | None Available | |
| Vargo John D | -- | None Available | |
| Evans William D | $1,895,000 | California Title Company | |
| Stam Ruth C | -- | -- |
Source: Public Records
Mortgage History
| Date | Status | Borrower | Loan Amount |
|---|---|---|---|
| Previous Owner | Evans William D | $955,800 |
Source: Public Records
Tax History Compared to Growth
Tax History
| Year | Tax Paid | Tax Assessment Tax Assessment Total Assessment is a certain percentage of the fair market value that is determined by local assessors to be the total taxable value of land and additions on the property. | Land | Improvement |
|---|---|---|---|---|
| 2025 | $60,046 | $4,989,377 | $4,096,183 | $893,194 |
| 2024 | $60,046 | $4,891,547 | $4,015,866 | $875,681 |
| 2023 | $58,723 | $4,795,635 | $3,937,124 | $858,511 |
| 2022 | $57,160 | $4,701,604 | $3,859,926 | $841,678 |
| 2021 | $56,766 | $4,609,417 | $3,784,242 | $825,175 |
| 2020 | $56,075 | $4,562,154 | $3,745,440 | $816,714 |
| 2019 | $55,158 | $4,472,700 | $3,672,000 | $800,700 |
| 2018 | $41,574 | $3,534,828 | $2,308,815 | $1,226,013 |
| 2017 | $40,587 | $3,465,519 | $2,263,545 | $1,201,974 |
| 2016 | $39,866 | $3,397,568 | $2,219,162 | $1,178,406 |
| 2015 | $39,275 | $3,346,535 | $2,185,829 | $1,160,706 |
| 2014 | $38,650 | $3,280,982 | $2,143,012 | $1,137,970 |
Source: Public Records
Map
Nearby Homes
- 5061 Mission Blvd
- 727 Sapphire St Unit 301
- 751-63 Turquoise St Unit 27-30
- 4767 Ocean Blvd
- 4767 Ocean Blvd Unit 411
- 4944 Cass St Unit 1003
- 4944 Cass St Unit 409
- 4944 Cass St Unit 407
- 972 Sapphire St Unit LA1
- 976 Sapphire St Unit LA3
- 911 Missouri St Unit 8
- 4667 Ocean Blvd Unit 106
- 4918 Dawes St Unit 3
- 4975 Dawes St
- 819 Van Nuys St
- 5341 Linda Way
- 835 Felspar St Week 6
- 623 Colima St
- 1154 Sapphire St
- 1148 Turquoise St
- 4926 Crystal Dr Unit 28
- 4936-38 Crystal Dr
- 4936 Crystal Dr Unit 38
- 4920 Crystal Dr Unit 22
- 4940 Crystal Dr Unit 42
- 4914 Crystal Dr Unit 16
- 4937 Crystal Dr
- 4946 Crystal Dr
- 4908 Crystal Dr
- 4904 Crystal Dr
- 4945 Crystal Dr Unit 47
- 4952 Crystal Dr Unit 54
- 4933 Ocean Blvd Unit 35
- 637 Loring St Unit 39
- 645 Loring St Unit 47
- 4961 Ocean Blvd Unit 63
- 4928 Dixie Dr Unit 30
- 4960 Crystal Dr
- 629 Loring St
- 653 Loring St Unit 55