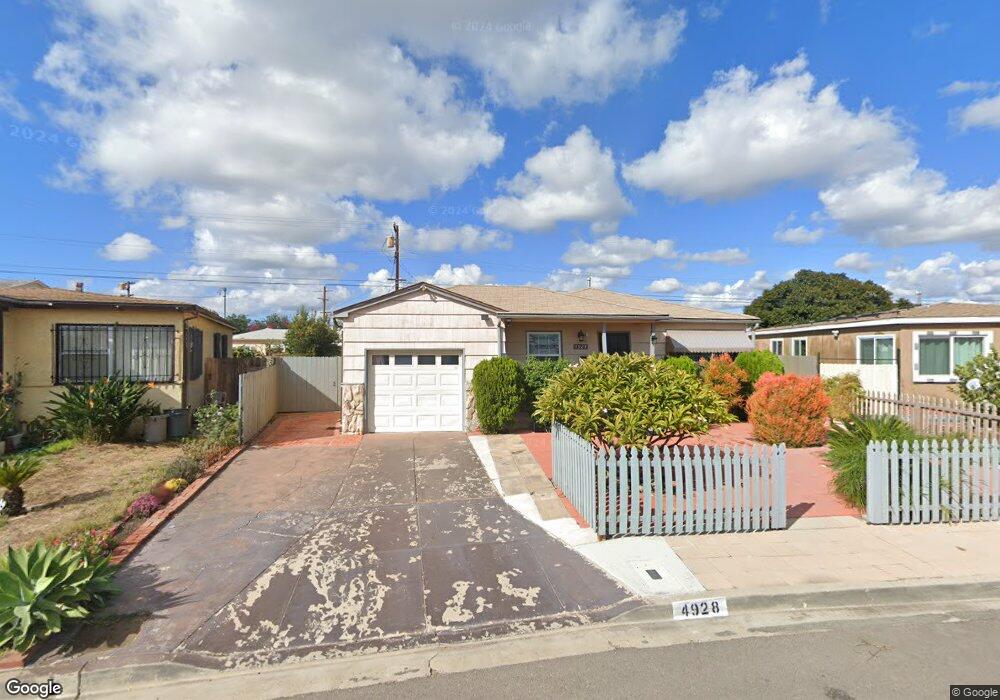
4928 Date Place San Diego, CA 92102
Ridgeview-Webster NeighborhoodEstimated Value: $642,000 - $708,000
3
Beds
1
Bath
1,014
Sq Ft
$666/Sq Ft
Est. Value
About This Home
This home is located at 4928 Date Place, San Diego, CA 92102 and is currently estimated at $675,443, approximately $666 per square foot. 4928 Date Place is a home located in San Diego County with nearby schools including Webster Elementary School, Millennial Tech Middle School, and Lincoln High School.
Ownership History
Date
Name
Owned For
Owner Type
Purchase Details
Closed on
Feb 24, 2015
Sold by
Taylor Tracy and Taylor Patricia K
Bought by
Nguyen Thinh Duc and Nguyen Ngoc Bich T
Current Estimated Value
Purchase Details
Closed on
Apr 6, 2001
Sold by
Norris Richard E and Norris Regina M
Bought by
Taylor Tracy and Taylor Patricia K
Home Financials for this Owner
Home Financials are based on the most recent Mortgage that was taken out on this home.
Original Mortgage
$172,296
Interest Rate
6.98%
Mortgage Type
FHA
Purchase Details
Closed on
Dec 7, 1993
Sold by
Jordan Florine and Norris Regina
Bought by
Norris Richard E and Norris Regina M
Home Financials for this Owner
Home Financials are based on the most recent Mortgage that was taken out on this home.
Original Mortgage
$84,000
Interest Rate
10.7%
Purchase Details
Closed on
Aug 1, 1992
Sold by
Jordan Florine
Bought by
Jordan Florine and Norris Regina Mae
Create a Home Valuation Report for This Property
The Home Valuation Report is an in-depth analysis detailing your home's value as well as a comparison with similar homes in the area
Home Values in the Area
Average Home Value in this Area
Purchase History
| Date | Buyer | Sale Price | Title Company |
|---|---|---|---|
| Nguyen Thinh Duc | $295,000 | Title 365 | |
| Taylor Tracy | $175,000 | Gateway Title Company | |
| Norris Richard E | -- | Stewart Title | |
| Jordan Florine | -- | -- |
Source: Public Records
Mortgage History
| Date | Status | Borrower | Loan Amount |
|---|---|---|---|
| Previous Owner | Taylor Tracy | $172,296 | |
| Previous Owner | Norris Richard E | $84,000 |
Source: Public Records
Tax History Compared to Growth
Tax History
| Year | Tax Paid | Tax Assessment Tax Assessment Total Assessment is a certain percentage of the fair market value that is determined by local assessors to be the total taxable value of land and additions on the property. | Land | Improvement |
|---|---|---|---|---|
| 2025 | $4,237 | $354,536 | $121,549 | $232,987 |
| 2024 | $4,237 | $347,585 | $119,166 | $228,419 |
| 2023 | $4,142 | $340,771 | $116,830 | $223,941 |
| 2022 | $4,030 | $334,090 | $114,540 | $219,550 |
| 2021 | $4,001 | $327,541 | $112,295 | $215,246 |
| 2020 | $3,953 | $324,183 | $111,144 | $213,039 |
| 2019 | $3,881 | $317,827 | $108,965 | $208,862 |
| 2018 | $3,629 | $311,596 | $106,829 | $204,767 |
| 2017 | $80 | $305,487 | $104,735 | $200,752 |
| 2016 | $3,483 | $299,498 | $102,682 | $196,816 |
| 2015 | $2,543 | $219,400 | $75,221 | $144,179 |
| 2014 | $2,503 | $215,103 | $73,748 | $141,355 |
Source: Public Records
Map
Nearby Homes
- 1828 Oakshire Ct
- 4927 Deaton Dr
- 5050 A St Unit 11
- 1951 47th St Unit 69
- 1951 47th St Unit 118
- 1951 47th St Unit SPC 44
- 1951 47th St Unit 100
- 2215 Susan Place
- 4918 Dalehaven Place
- 1651 Pentecost Way Unit 1
- 1653 Pentecost Way Unit 12
- 1647 Pentecost Way Unit 11
- 1679 Pentecost Way Unit 5
- 2151 54th St
- 1825 Bayview Heights Dr Unit 97
- 000 Hal St Unit 30
- 2094 Laurinda Place
- 5233 Caminito Cachorro
- 5612 Zircon St
- 5550 Grape St