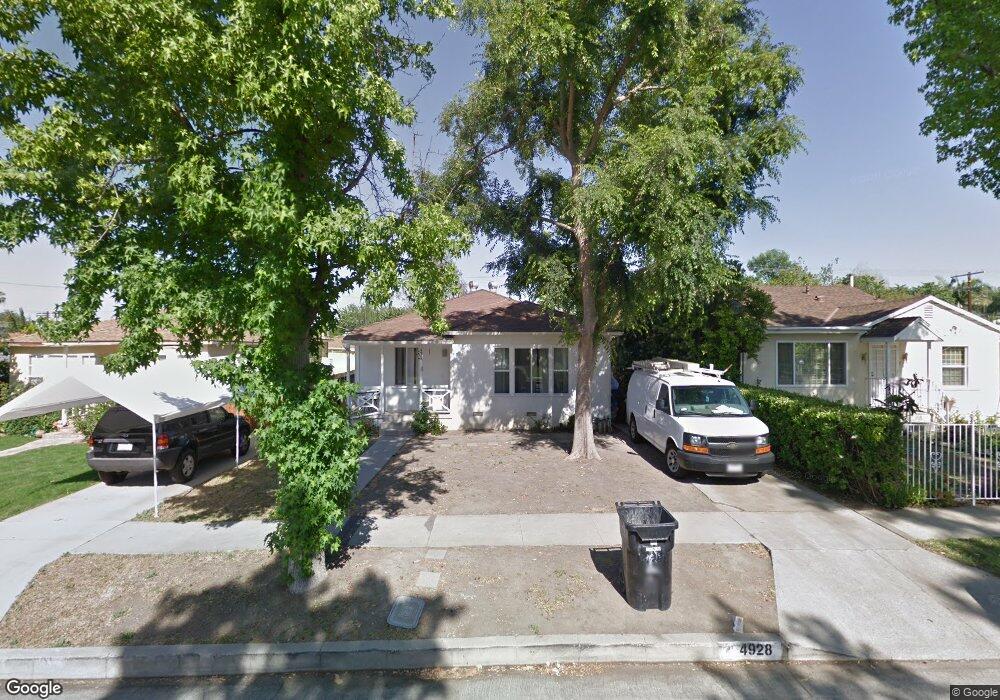
4928 Enfield Ave Encino, CA 91316
Estimated Value: $835,000 - $1,491,000
3
Beds
1
Bath
1,032
Sq Ft
$1,107/Sq Ft
Est. Value
About This Home
This home is located at 4928 Enfield Ave, Encino, CA 91316 and is currently estimated at $1,142,843, approximately $1,107 per square foot. 4928 Enfield Ave is a home located in Los Angeles County with nearby schools including Gaspar De Portola Middle School, Nestle Avenue Charter, and Emelita Street Elementary.
Ownership History
Date
Name
Owned For
Owner Type
Purchase Details
Closed on
Nov 11, 2021
Sold by
Eshaghian Mike Masoud and Farzaneh Farzan
Bought by
Eshaghian Family Trust and Eshaghian
Current Estimated Value
Purchase Details
Closed on
Jul 16, 2021
Sold by
Eshaghian Mike Masoud and Farzaneh Farzan
Bought by
Eshaghian Mike M and Eshaghian Farzaneh Farzan
Purchase Details
Closed on
Mar 12, 1997
Sold by
Federal National Mortgage Association
Bought by
Eshaghian Mike Masoud and Eshaghian Farzaneh Farzan
Home Financials for this Owner
Home Financials are based on the most recent Mortgage that was taken out on this home.
Original Mortgage
$128,600
Interest Rate
7.56%
Mortgage Type
Seller Take Back
Purchase Details
Closed on
Dec 5, 1996
Sold by
Takamatsu Atsushi and Federal National Mortgage Asso
Bought by
Federal National Mortgage Association
Create a Home Valuation Report for This Property
The Home Valuation Report is an in-depth analysis detailing your home's value as well as a comparison with similar homes in the area
Home Values in the Area
Average Home Value in this Area
Purchase History
| Date | Buyer | Sale Price | Title Company |
|---|---|---|---|
| Eshaghian Family Trust | -- | Maillian Leanne E | |
| Eshaghian Mike M | -- | North American Title | |
| Eshaghian Mike Masoud | $154,000 | Investors Title Company | |
| Federal National Mortgage Association | $154,750 | Stewart Title |
Source: Public Records
Mortgage History
| Date | Status | Borrower | Loan Amount |
|---|---|---|---|
| Previous Owner | Eshaghian Mike Masoud | $128,600 |
Source: Public Records
Tax History Compared to Growth
Tax History
| Year | Tax Paid | Tax Assessment Tax Assessment Total Assessment is a certain percentage of the fair market value that is determined by local assessors to be the total taxable value of land and additions on the property. | Land | Improvement |
|---|---|---|---|---|
| 2025 | $3,198 | $250,789 | $200,641 | $50,148 |
| 2024 | $3,198 | $245,872 | $196,707 | $49,165 |
| 2023 | $3,140 | $241,051 | $192,850 | $48,201 |
| 2022 | $3,016 | $236,325 | $189,069 | $47,256 |
| 2021 | $2,977 | $231,692 | $185,362 | $46,330 |
| 2020 | $3,003 | $229,317 | $183,462 | $45,855 |
| 2019 | $2,891 | $224,821 | $179,865 | $44,956 |
| 2018 | $2,854 | $220,414 | $176,339 | $44,075 |
| 2017 | $2,792 | $216,093 | $172,882 | $43,211 |
| 2016 | $2,708 | $211,857 | $169,493 | $42,364 |
| 2015 | $2,671 | $208,676 | $166,948 | $41,728 |
| 2014 | $2,688 | $204,589 | $163,678 | $40,911 |
Source: Public Records
Map
Nearby Homes
- 4860 Enfield Ave
- 5004 Enfield Ave
- 17962 Valley Vista Blvd
- 4841 Alonzo Ave
- 18057 Valley Vista Blvd
- 4854 Alonzo Ave
- 5022 Lindley Ave
- 17733 Palora St
- 17980 Rancho St
- 5119 Enfield Ave
- 18090 Karen Dr
- 17115 Rancho St
- 4551 Alonzo Ave
- 5142 Zelzah Ave Unit 25
- 17914 Magnolia Blvd Unit 204
- 17914 Magnolia Blvd Unit 125
- 17914 Magnolia Blvd Unit 135
- 4571 Gable Dr
- 5305 5305 White Oak Unit F
- 4718 White Oak Ave
- 4924 Enfield Ave
- 4934 Enfield Ave
- 4920 Enfield Ave
- 4938 Enfield Ave
- 4942 Enfield Ave
- 4929 Zelzah Ave
- 4925 Zelzah Ave
- 4935 Zelzah Ave
- 4939 Zelzah Ave
- 4921 Zelzah Ave
- 4946 Enfield Ave
- 4910 Enfield Ave
- 4917 Zelzah Ave
- 4943 Zelzah Ave
- 4929 Enfield Ave
- 4935 Enfield Ave
- 4925 Enfield Ave
- 4939 Enfield Ave
- 4921 Enfield Ave
- 4906 Enfield Ave