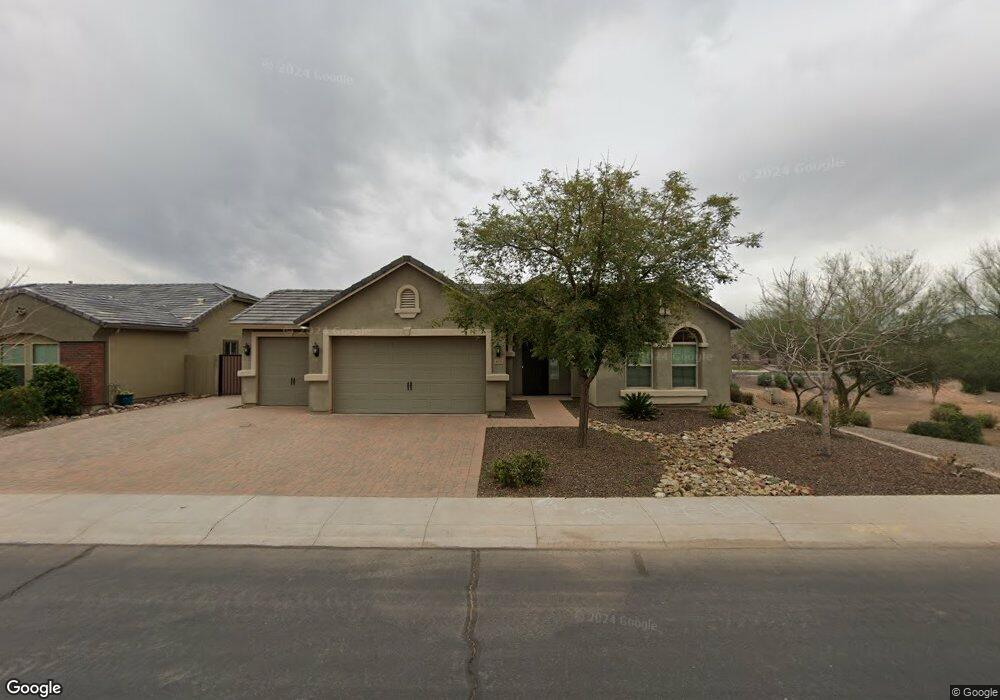
4928 S Brice Cir Mesa, AZ 85212
Superstition Vistas NeighborhoodEstimated Value: $523,000 - $596,000
5
Beds
3
Baths
2,013
Sq Ft
$275/Sq Ft
Est. Value
About This Home
This home is located at 4928 S Brice Cir, Mesa, AZ 85212 and is currently estimated at $553,368, approximately $274 per square foot. 4928 S Brice Cir is a home with nearby schools including Gateway Polytechnic Academy, Eastmark High School, and Great Hearts Blossom Rock.
Ownership History
Date
Name
Owned For
Owner Type
Purchase Details
Closed on
Jan 8, 2021
Sold by
Giroux Joshua John and Giroux Nikole Marie
Bought by
Giroux Joshua John and Giroux Nikole Marie
Current Estimated Value
Home Financials for this Owner
Home Financials are based on the most recent Mortgage that was taken out on this home.
Original Mortgage
$310,000
Outstanding Balance
$276,138
Interest Rate
2.6%
Mortgage Type
Purchase Money Mortgage
Estimated Equity
$277,230
Purchase Details
Closed on
Jul 16, 2020
Sold by
Giroux Joshua and Giroux Nikole
Bought by
Giroux Joshua John and Giroux Nikole Marie
Purchase Details
Closed on
Nov 14, 2016
Sold by
Providence Homes Inc
Bought by
Giroux Joshua and Giroux Nikole
Home Financials for this Owner
Home Financials are based on the most recent Mortgage that was taken out on this home.
Original Mortgage
$275,793
Interest Rate
3.25%
Mortgage Type
FHA
Create a Home Valuation Report for This Property
The Home Valuation Report is an in-depth analysis detailing your home's value as well as a comparison with similar homes in the area
Home Values in the Area
Average Home Value in this Area
Purchase History
| Date | Buyer | Sale Price | Title Company |
|---|---|---|---|
| Giroux Joshua John | -- | Accommodation | |
| Giroux Joshua John | -- | None Available | |
| Giroux Joshua | $289,572 | Security Title Agency Inc | |
| Providence Homes Inc | $253,375 | Security Title Agency Inc | |
| Providence Development Inc | $60,000 | Security Title Agency Inc |
Source: Public Records
Mortgage History
| Date | Status | Borrower | Loan Amount |
|---|---|---|---|
| Open | Giroux Joshua John | $310,000 | |
| Previous Owner | Giroux Joshua | $275,793 |
Source: Public Records
Tax History Compared to Growth
Tax History
| Year | Tax Paid | Tax Assessment Tax Assessment Total Assessment is a certain percentage of the fair market value that is determined by local assessors to be the total taxable value of land and additions on the property. | Land | Improvement |
|---|---|---|---|---|
| 2025 | $1,837 | $23,296 | -- | -- |
| 2024 | $1,978 | $22,187 | -- | -- |
| 2023 | $1,978 | $41,580 | $8,310 | $33,270 |
| 2022 | $1,907 | $33,230 | $6,640 | $26,590 |
| 2021 | $2,013 | $30,530 | $6,100 | $24,430 |
| 2020 | $1,948 | $28,780 | $5,750 | $23,030 |
| 2019 | $1,881 | $25,170 | $5,030 | $20,140 |
| 2018 | $1,783 | $22,680 | $4,530 | $18,150 |
| 2017 | $403 | $8,055 | $8,055 | $0 |
| 2016 | $402 | $7,695 | $7,695 | $0 |
| 2015 | $353 | $8,192 | $8,192 | $0 |
Source: Public Records
Map
Nearby Homes
- 5028 S Brice
- 5060 S Clancy
- 3372 W Shanley Ave
- 11346 E Spaulding Ave
- 3274 W Stradling Ave
- 3226 W Stanton Ave
- 11258 E Shelley Ave
- 0 Unknown -- Unit 5 6809675
- 9932 S Desert View Dr
- 11441 E Sonrisa Ave
- 11263 E Savannah Ave
- 11235 E Sable Ave
- 11436 E Sonrisa Ave
- 4816 S Emery Unit 1
- 4746 S Emery
- 11134 E Sombra Ave
- 11225 E Sonrisa Ave
- XXXXX S Mountain Rd Unit 1
- 11225 E Sylvan Ave
- 11528 E Sebring Ave
- 4934 S Brice Cir
- 4940 S Brice Cir
- 4933 S Brice Cir
- 4927 S Brice Cir
- 4924 S Calderon
- 4921 S Brice Cir
- 4918 S Calderon
- 4946 S Brice Cir
- 4936 S Calderon
- 4945 S Brice Cir
- 4912 S Calderon
- 4915 S Brice Cir
- 4951 S Brice Cir
- 4952 S Brice Cir
- 4906 S Calderon
- 4944 S Calderon
- 11459 E Stanton Cir
- 4909 S Brice
- 11463 E Spaulding Ave
- 11436 E Spaulding Ave