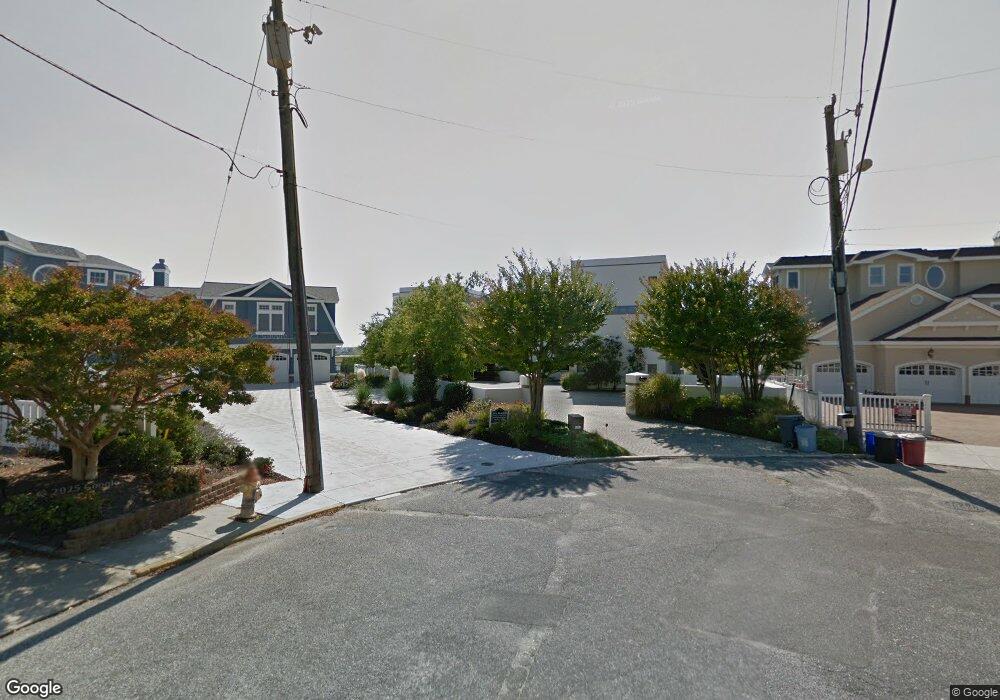
4929 5th Ave Avalon, NJ 08202
Estimated Value: $6,711,000 - $9,858,390
Studio
--
Bath
7,600
Sq Ft
$1,071/Sq Ft
Est. Value
About This Home
This home is located at 4929 5th Ave, Avalon, NJ 08202 and is currently estimated at $8,137,797, approximately $1,070 per square foot. 4929 5th Ave is a home with nearby schools including Avalon Elementary School.
Ownership History
Date
Name
Owned For
Owner Type
Purchase Details
Closed on
Apr 3, 2014
Sold by
Neducsin Daniel R and Neducsin Luana B
Bought by
The Revocable Trust Of Daniel R Neducsin
Current Estimated Value
Purchase Details
Closed on
May 21, 1990
Sold by
State Of New Jersey Dep
Bought by
Nedugsin Daniel R and Nedugsin Luana B
Purchase Details
Closed on
Feb 26, 1988
Bought by
Neducsin,Daniel & Luana @ Mgmt Inc
Create a Home Valuation Report for This Property
The Home Valuation Report is an in-depth analysis detailing your home's value as well as a comparison with similar homes in the area
Home Values in the Area
Average Home Value in this Area
Purchase History
| Date | Buyer | Sale Price | Title Company |
|---|---|---|---|
| The Revocable Trust Of Daniel R Neducsin | -- | None Available | |
| Nedugsin Daniel R | $66,700 | -- | |
| Neducsin,Daniel & Luana @ Mgmt Inc | $490,000 | -- |
Source: Public Records
Tax History
| Year | Tax Paid | Tax Assessment Tax Assessment Total Assessment is a certain percentage of the fair market value that is determined by local assessors to be the total taxable value of land and additions on the property. | Land | Improvement |
|---|---|---|---|---|
| 2025 | $36,755 | $5,986,100 | $3,824,600 | $2,161,500 |
| 2024 | $36,755 | $5,986,100 | $3,824,600 | $2,161,500 |
| 2023 | $36,455 | $5,986,100 | $3,824,600 | $2,161,500 |
| 2022 | $34,001 | $5,986,100 | $3,824,600 | $2,161,500 |
| 2021 | $32,744 | $5,986,100 | $3,824,600 | $2,161,500 |
| 2020 | $31,487 | $5,986,100 | $3,824,600 | $2,161,500 |
| 2019 | $30,529 | $5,986,100 | $3,824,600 | $2,161,500 |
| 2018 | $29,212 | $5,986,100 | $3,824,600 | $2,161,500 |
| 2017 | $32,130 | $5,778,700 | $3,785,000 | $1,993,700 |
| 2016 | $31,783 | $5,778,700 | $3,785,000 | $1,993,700 |
| 2015 | $31,263 | $5,778,700 | $3,785,000 | $1,993,700 |
| 2014 | $30,916 | $5,778,700 | $3,785,000 | $1,993,700 |
Source: Public Records
Map
Nearby Homes
- 4610 4th Ave
- 4640 Ocean Dr
- 256 42nd St
- 5499 Dune Dr
- 5765 Ocean Dr
- 264 41st St
- 4040 Dune Dr
- 198 40th St
- 6229 Dune Dr
- 253 35th St Unit WEST
- 3429 Dune Dr
- 150 64th St
- 162 33rd St
- 173 33rd St Unit 3
- 6762 Ocean Dr Unit 6762
- 6772 Ocean Dr Unit 6772
- 179 32nd St
- 2934 Ocean Dr Unit North
- 3149 First Ave
- 55 32nd St W Unit C2B
Your Personal Tour Guide
Ask me questions while you tour the home.