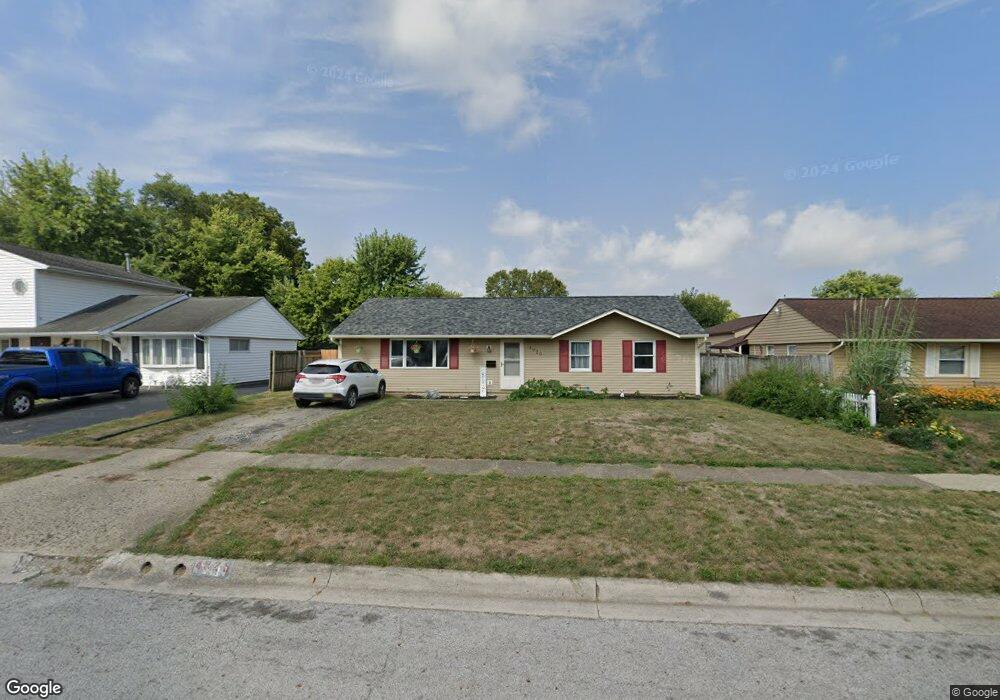
4929 Root St Columbus, OH 43207
Obetz-Lockbourne NeighborhoodEstimated Value: $214,713 - $258,000
3
Beds
1
Bath
1,225
Sq Ft
$192/Sq Ft
Est. Value
About This Home
This home is located at 4929 Root St, Columbus, OH 43207 and is currently estimated at $235,178, approximately $191 per square foot. 4929 Root St is a home located in Franklin County with nearby schools including Hamilton Elementary School, Hamilton Intermediate School, and Hamilton Middle School.
Ownership History
Date
Name
Owned For
Owner Type
Purchase Details
Closed on
Jan 18, 2011
Sold by
Wall Mark D and Wall Janet M
Bought by
Allmandinger Andrew K and Allmandinger Melissa Marie
Current Estimated Value
Purchase Details
Closed on
Dec 30, 2009
Sold by
Bank Of America National Association
Bought by
Wall Mark D and Wall Janet M
Purchase Details
Closed on
Oct 8, 2009
Sold by
Wright Janice K and Wright Michael D
Bought by
Bank Of America National Association
Purchase Details
Closed on
Sep 19, 1980
Bought by
Wright Michael D
Create a Home Valuation Report for This Property
The Home Valuation Report is an in-depth analysis detailing your home's value as well as a comparison with similar homes in the area
Home Values in the Area
Average Home Value in this Area
Purchase History
| Date | Buyer | Sale Price | Title Company |
|---|---|---|---|
| Allmandinger Andrew K | $32,000 | Valmer Land | |
| Wall Mark D | $32,000 | Ohio Land R | |
| Bank Of America National Association | $60,000 | None Available | |
| Wright Michael D | $36,500 | -- |
Source: Public Records
Tax History Compared to Growth
Tax History
| Year | Tax Paid | Tax Assessment Tax Assessment Total Assessment is a certain percentage of the fair market value that is determined by local assessors to be the total taxable value of land and additions on the property. | Land | Improvement |
|---|---|---|---|---|
| 2024 | $2,788 | $59,610 | $17,500 | $42,110 |
| 2023 | $2,774 | $59,605 | $17,500 | $42,105 |
| 2022 | $1,822 | $32,830 | $6,160 | $26,670 |
| 2021 | $1,847 | $32,830 | $6,160 | $26,670 |
| 2020 | $2,048 | $32,830 | $6,160 | $26,670 |
| 2019 | $1,769 | $27,340 | $5,110 | $22,230 |
| 2018 | $873 | $27,340 | $5,110 | $22,230 |
| 2017 | $1,673 | $27,340 | $5,110 | $22,230 |
| 2016 | $2,174 | $29,130 | $6,270 | $22,860 |
| 2015 | $970 | $29,130 | $6,270 | $22,860 |
| 2014 | $1,828 | $29,130 | $6,270 | $22,860 |
| 2013 | $979 | $32,375 | $6,965 | $25,410 |
Source: Public Records
Map
Nearby Homes
- 4917 Fishburn Ct
- 920 Cherrydale Ave
- 1031 Secrest Ave
- 1059 Belford Ave
- 5083 Meadowbrook Dr
- 1091 Secrest Ave
- 1099 Secrest Ave
- 5140 Meadowbrook Dr
- 5081 Lockbourne Rd
- 1292 Webb Dr Unit Lot 83
- 1291 Webb Dr Unit Lot 90
- 1315 Webb Dr Unit Lot 93
- 5340 Edgeview Rd
- 4434 Butler Farms Dr
- 4175 Holstein Dr
- 4241 Gelbray Ct
- 520 Wyndham Ridge Dr
- 353 Kear St
- 785 Scarlett Ln
- 4410 Holstein Dr