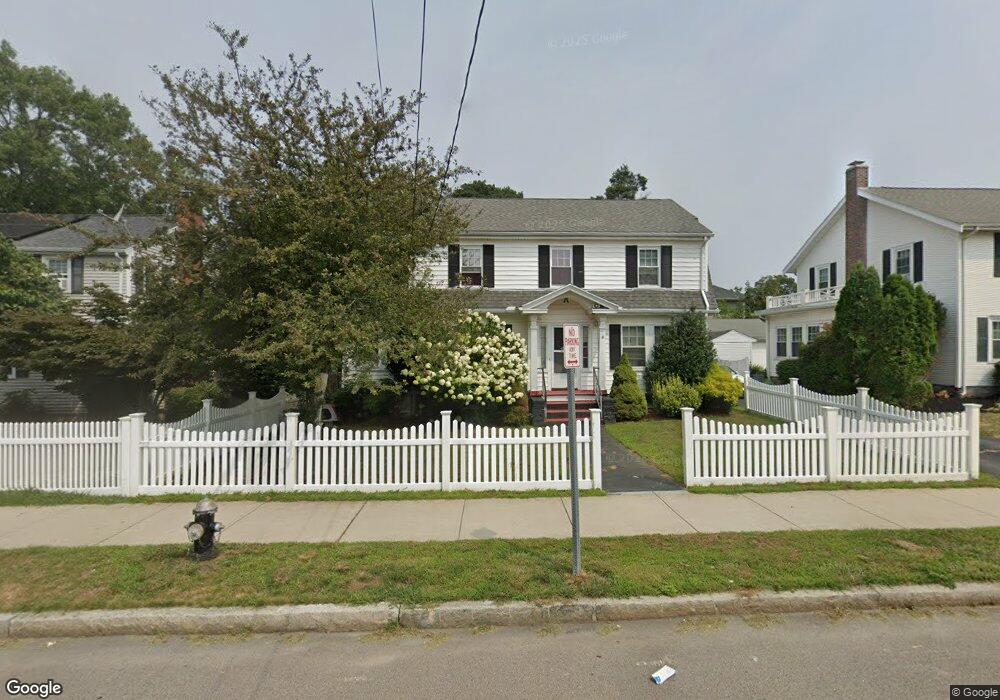
493 W Elm St Brockton, MA 02301
Estimated Value: $591,321 - $615,000
4
Beds
2
Baths
1,849
Sq Ft
$328/Sq Ft
Est. Value
About This Home
This home is located at 493 W Elm St, Brockton, MA 02301 and is currently estimated at $607,080, approximately $328 per square foot. 493 W Elm St is a home located in Plymouth County with nearby schools including Manthala George Jr. School, Hancock Elementary School, and Louis F Angelo Elementary School.
Ownership History
Date
Name
Owned For
Owner Type
Purchase Details
Closed on
Jan 18, 2022
Sold by
Ramhit Kaloutee D
Bought by
Harpoo Karina S and Ramhit Cyndi
Current Estimated Value
Purchase Details
Closed on
Nov 2, 1998
Sold by
Chouinard Claude and Chouinard Betsy R
Bought by
Ramhit Kaloutee D
Purchase Details
Closed on
May 31, 1994
Sold by
Shurtleff Jonathan N and Shurtleff Diane
Bought by
Chouinard Claude R
Create a Home Valuation Report for This Property
The Home Valuation Report is an in-depth analysis detailing your home's value as well as a comparison with similar homes in the area
Home Values in the Area
Average Home Value in this Area
Purchase History
| Date | Buyer | Sale Price | Title Company |
|---|---|---|---|
| Harpoo Karina S | -- | None Available | |
| Ramhit Kaloutee D | $132,000 | -- | |
| Chouinard Claude R | $123,720 | -- |
Source: Public Records
Mortgage History
| Date | Status | Borrower | Loan Amount |
|---|---|---|---|
| Previous Owner | Chouinard Claude R | $160,500 | |
| Previous Owner | Chouinard Claude R | $167,000 | |
| Previous Owner | Chouinard Claude R | $22,000 |
Source: Public Records
Tax History Compared to Growth
Tax History
| Year | Tax Paid | Tax Assessment Tax Assessment Total Assessment is a certain percentage of the fair market value that is determined by local assessors to be the total taxable value of land and additions on the property. | Land | Improvement |
|---|---|---|---|---|
| 2025 | $6,285 | $519,000 | $143,700 | $375,300 |
| 2024 | $5,767 | $479,800 | $143,700 | $336,100 |
| 2023 | $5,310 | $409,100 | $108,300 | $300,800 |
| 2022 | $5,128 | $367,100 | $98,300 | $268,800 |
| 2021 | $4,810 | $331,700 | $90,100 | $241,600 |
| 2020 | $4,781 | $315,600 | $86,600 | $229,000 |
| 2019 | $6,737 | $295,600 | $79,700 | $215,900 |
| 2018 | $4,046 | $265,500 | $79,700 | $185,800 |
| 2017 | $4,046 | $251,300 | $79,700 | $171,600 |
| 2016 | $4,536 | $261,300 | $76,000 | $185,300 |
| 2015 | $4,078 | $224,700 | $76,000 | $148,700 |
| 2014 | $3,981 | $219,600 | $76,000 | $143,600 |
Source: Public Records
Map
Nearby Homes
- 48 N Belcher Ave
- 72 W Elm Terrace
- 137 Boylston St
- 161 Moraine St
- 15 Byron Ave
- 175 Belmont Ave
- 67 Sycamore Ave Unit 3
- 265 Boylston St
- 28 Fern Ave
- 25 Monson St
- 17 Moraine Place
- 282 Belmont St
- 60 Elm Ave
- 190 Highland St
- 37 West St
- 50 Manomet St
- 45 Briarcliff Rd
- 281 Spring St
- 227 W Elm St Unit 3
- 124 Manomet St