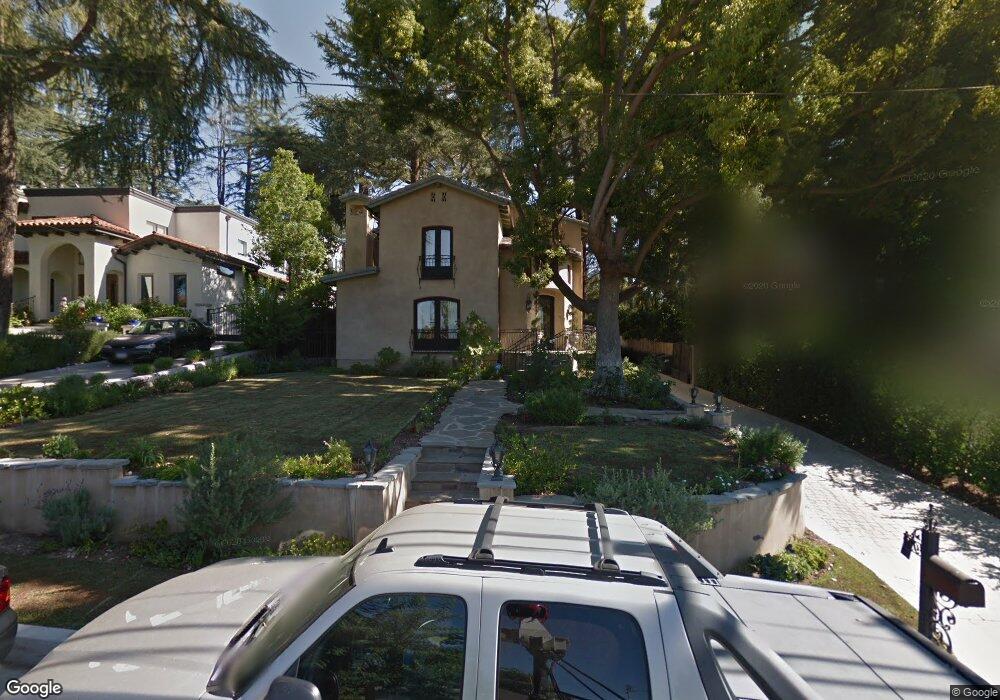
4930 Palm Dr La Canada Flintridge, CA 91011
Estimated Value: $3,081,000 - $3,469,000
3
Beds
2
Baths
--
Sq Ft
0.33
Acres
About This Home
This home is located at 4930 Palm Dr, La Canada Flintridge, CA 91011 and is currently estimated at $3,247,645. 4930 Palm Dr is a home located in Los Angeles County with nearby schools including Palm Crest Elementary School, La Canada High School, and La Canada Preparatory School.
Ownership History
Date
Name
Owned For
Owner Type
Purchase Details
Closed on
Apr 11, 2021
Sold by
Demirchian Hagop and Demirchian Anik
Bought by
Karbouchian Zeron and Karbouchian Karen
Current Estimated Value
Purchase Details
Closed on
Feb 25, 2008
Sold by
Demerdjian Hagop and Demirchian Anik
Bought by
Demerdjian Hagop and Demirchian Anik
Purchase Details
Closed on
Jan 31, 2006
Sold by
Haas Llc
Bought by
Demerdjian Hagop and Demirchian Anik
Home Financials for this Owner
Home Financials are based on the most recent Mortgage that was taken out on this home.
Original Mortgage
$417,000
Interest Rate
6.15%
Mortgage Type
Purchase Money Mortgage
Purchase Details
Closed on
May 5, 2005
Sold by
Mcclain Marvin R and Mc Clain Patricia W
Bought by
Haas Llc
Home Financials for this Owner
Home Financials are based on the most recent Mortgage that was taken out on this home.
Original Mortgage
$975,000
Interest Rate
5.84%
Mortgage Type
Purchase Money Mortgage
Create a Home Valuation Report for This Property
The Home Valuation Report is an in-depth analysis detailing your home's value as well as a comparison with similar homes in the area
Home Values in the Area
Average Home Value in this Area
Purchase History
| Date | Buyer | Sale Price | Title Company |
|---|---|---|---|
| Karbouchian Zeron | -- | None Listed On Document | |
| Demerdjian Hagop | -- | None Available | |
| Demerdjian Hagop | $1,100,000 | Ort | |
| Haas Llc | $1,222,000 | Chicago Title Co |
Source: Public Records
Mortgage History
| Date | Status | Borrower | Loan Amount |
|---|---|---|---|
| Previous Owner | Demerdjian Hagop | $417,000 | |
| Previous Owner | Haas Llc | $975,000 |
Source: Public Records
Tax History Compared to Growth
Tax History
| Year | Tax Paid | Tax Assessment Tax Assessment Total Assessment is a certain percentage of the fair market value that is determined by local assessors to be the total taxable value of land and additions on the property. | Land | Improvement |
|---|---|---|---|---|
| 2025 | $23,605 | $2,116,150 | $1,432,251 | $683,899 |
| 2024 | $23,605 | $2,074,658 | $1,404,168 | $670,490 |
| 2023 | $23,206 | $2,033,980 | $1,376,636 | $657,344 |
| 2022 | $12,385 | $1,090,736 | $464,007 | $626,729 |
| 2021 | $13,242 | $1,069,350 | $454,909 | $614,441 |
| 2020 | $13,109 | $1,058,386 | $450,245 | $608,141 |
| 2019 | $12,890 | $1,037,634 | $441,417 | $596,217 |
| 2018 | $12,664 | $1,017,289 | $432,762 | $584,527 |
| 2016 | $12,220 | $977,788 | $415,958 | $561,830 |
| 2015 | $12,064 | $963,101 | $409,710 | $553,391 |
| 2014 | $11,911 | $944,236 | $401,685 | $542,551 |
Source: Public Records
Map
Nearby Homes
- 1929 Lyans Dr
- 1737 Fairmount Ave
- 5245 Bubbling Well Ln
- 5220 Palm Dr
- 0 La Sierra & Palm Dr
- 4644 Hillard Ave
- 5260 Palm Dr
- 4616 Castle Rd
- 4639 El Camino Corto
- 2102 La Canada Crest Dr Unit B
- 4430 Rosebank Dr
- 4479 Rockland Place
- 4531 El Camino Corto
- 4940 Ocean View Blvd
- 4720 Olive Ct
- 5123 Caroli Ln
- 1230 Pequena Ln
- 4467 Ardara Place
- 4326 Briggs Ave
- 5130 Hayman Ave