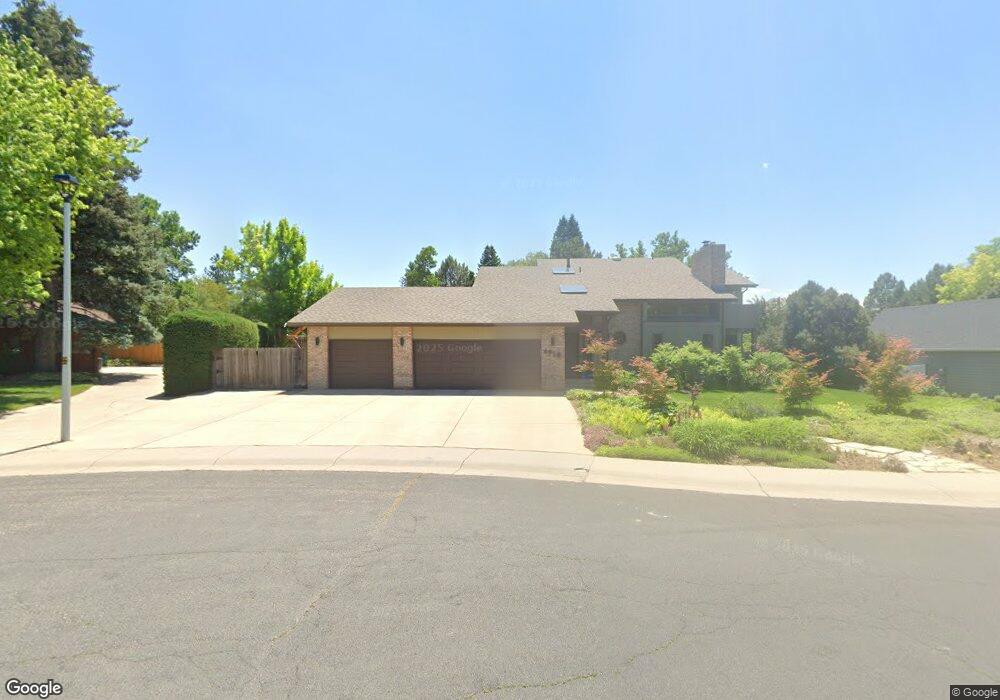
4930 W 12th Street Dr Greeley, CO 80634
Country Club West NeighborhoodEstimated Value: $540,323 - $634,000
4
Beds
3
Baths
3,700
Sq Ft
$158/Sq Ft
Est. Value
About This Home
This home is located at 4930 W 12th Street Dr, Greeley, CO 80634 and is currently estimated at $583,831, approximately $157 per square foot. 4930 W 12th Street Dr is a home located in Weld County with nearby schools including Monfort Elementary School, Heath Middle School, and Greeley Central High School.
Ownership History
Date
Name
Owned For
Owner Type
Purchase Details
Closed on
May 27, 2005
Sold by
Houtchens Mary Jo
Bought by
Conway Nancy J and Conway Jack J
Current Estimated Value
Home Financials for this Owner
Home Financials are based on the most recent Mortgage that was taken out on this home.
Original Mortgage
$208,000
Outstanding Balance
$106,766
Interest Rate
5.5%
Mortgage Type
Fannie Mae Freddie Mac
Estimated Equity
$477,065
Purchase Details
Closed on
Jan 15, 1999
Sold by
Greener Daniel M
Bought by
Gibson Contracting Inc
Home Financials for this Owner
Home Financials are based on the most recent Mortgage that was taken out on this home.
Original Mortgage
$185,000
Interest Rate
6.68%
Mortgage Type
Construction
Purchase Details
Closed on
Aug 2, 1991
Sold by
Waterloo Robert F and Waterloo Kathleen M
Bought by
Houtchens Mary Jo
Purchase Details
Closed on
Jan 6, 1983
Create a Home Valuation Report for This Property
The Home Valuation Report is an in-depth analysis detailing your home's value as well as a comparison with similar homes in the area
Home Values in the Area
Average Home Value in this Area
Purchase History
| Date | Buyer | Sale Price | Title Company |
|---|---|---|---|
| Conway Nancy J | $260,000 | -- | |
| Gibson Contracting Inc | $32,500 | -- | |
| Sullivan Kendall R | $38,000 | -- | |
| Houtchens Mary Jo | $170,000 | -- | |
| -- | -- | -- | |
| Waterloo Robert F | $160,400 | -- |
Source: Public Records
Mortgage History
| Date | Status | Borrower | Loan Amount |
|---|---|---|---|
| Open | Conway Nancy J | $208,000 | |
| Previous Owner | Sullivan Kendall R | $185,000 |
Source: Public Records
Tax History Compared to Growth
Tax History
| Year | Tax Paid | Tax Assessment Tax Assessment Total Assessment is a certain percentage of the fair market value that is determined by local assessors to be the total taxable value of land and additions on the property. | Land | Improvement |
|---|---|---|---|---|
| 2025 | $2,638 | $32,290 | $5,060 | $27,230 |
| 2024 | $2,638 | $32,290 | $5,060 | $27,230 |
| 2023 | $2,516 | $35,130 | $5,070 | $30,060 |
| 2022 | $2,422 | $27,780 | $5,210 | $22,570 |
| 2021 | $2,499 | $28,580 | $5,360 | $23,220 |
| 2020 | $2,355 | $27,020 | $3,790 | $23,230 |
| 2019 | $2,362 | $27,020 | $3,790 | $23,230 |
| 2018 | $2,033 | $24,550 | $3,740 | $20,810 |
| 2017 | $2,044 | $24,550 | $3,740 | $20,810 |
| 2016 | $1,663 | $22,480 | $2,910 | $19,570 |
| 2015 | $1,657 | $22,480 | $2,910 | $19,570 |
| 2014 | $1,421 | $18,810 | $2,590 | $16,220 |
Source: Public Records
Map
Nearby Homes
- 4949 W 13th St
- 1502 51st Ave
- 1204 50th Ave
- 1506 51st Ave
- 1211 51st Ave
- 1218 48th Ave
- 5114 W 11th St
- 1005 48th Ave Unit B3
- 5602 W 16th Street Rd
- 4547 W 14th St
- 5627 W 16th Street Rd
- 5601 18th St Unit 30
- 5601 18th St Unit 3
- 5312 W 11th St
- 5601 W 18th St Unit 20
- 1009 47th Ave
- 950 52nd Avenue Ct Unit 2
- 950 52nd Avenue Ct Unit 1
- 4471 W Pioneer Dr Unit 79
- 4490 W Pioneer Dr Unit 50
- 4938 W 12th Street Dr
- 1269 49th Avenue Ct
- 4913 W 12th Street Dr
- 4921 W 12th Street Dr
- 4927 W 12th Street Dr
- 4933 W 13th St
- 4941 W 13th St
- 4935 W 12th Street Dr
- 1247 49th Avenue Ct
- 1270 49th Avenue Ct
- 1261 49th Ave
- 4946 W 12th St
- 1253 49th Ave
- 4946 W 12th Street Dr
- 1239 49th Avenue Ct
- 1236 49th Avenue Ct
- 1269 49th Ave
- 1244 50th Ave
- 1278 49th Avenue Ct
- 4957 W 13th St