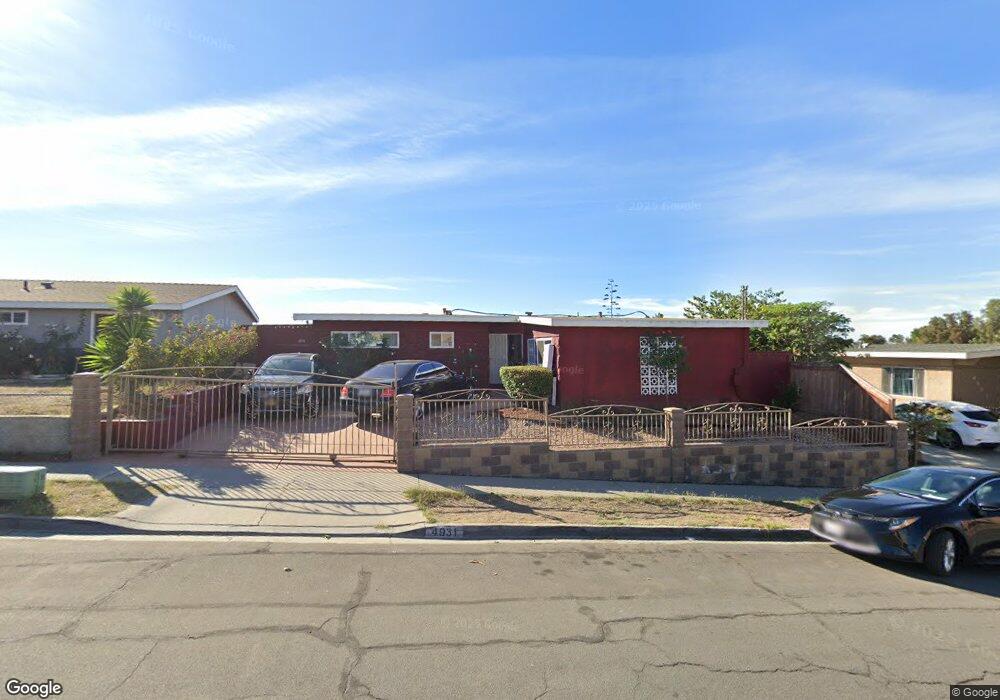
4931 Ocean View Blvd San Diego, CA 92113
Lincoln Park NeighborhoodEstimated Value: $709,547 - $980,000
3
Beds
2
Baths
1,754
Sq Ft
$468/Sq Ft
Est. Value
About This Home
This home is located at 4931 Ocean View Blvd, San Diego, CA 92113 and is currently estimated at $821,137, approximately $468 per square foot. 4931 Ocean View Blvd is a home located in San Diego County with nearby schools including Porter Elementary School, Knox Middle, and Lincoln High School.
Ownership History
Date
Name
Owned For
Owner Type
Purchase Details
Closed on
Mar 22, 2018
Sold by
Mitchell Brian Keith
Bought by
Mitchell Brian Keith and Mitchell Family Trust
Current Estimated Value
Purchase Details
Closed on
May 12, 2017
Sold by
Mitchell Brian Keith and Mitchell Willie Lee
Bought by
Mitchell Brian Keith and Willie Lee Mitchell Trust
Home Financials for this Owner
Home Financials are based on the most recent Mortgage that was taken out on this home.
Original Mortgage
$158,730
Interest Rate
4.1%
Mortgage Type
FHA
Purchase Details
Closed on
Apr 19, 2017
Sold by
Mitchell Brian Keith
Bought by
Mitchell Brian Keith
Home Financials for this Owner
Home Financials are based on the most recent Mortgage that was taken out on this home.
Original Mortgage
$158,730
Interest Rate
4.1%
Mortgage Type
FHA
Purchase Details
Closed on
Jun 24, 2009
Sold by
Mitchell Willie Lee
Bought by
Mitchell Willie Lee
Create a Home Valuation Report for This Property
The Home Valuation Report is an in-depth analysis detailing your home's value as well as a comparison with similar homes in the area
Home Values in the Area
Average Home Value in this Area
Purchase History
| Date | Buyer | Sale Price | Title Company |
|---|---|---|---|
| Mitchell Brian Keith | -- | None Available | |
| Mitchell Brian Keith | -- | None Available | |
| Mitchell Brian Keith | -- | None Available | |
| Mitchell Brian Keith | -- | Wfg National Title | |
| Mitchell Brian Keith | -- | None Available | |
| Mitchell Willie Lee | -- | None Available |
Source: Public Records
Mortgage History
| Date | Status | Borrower | Loan Amount |
|---|---|---|---|
| Closed | Mitchell Brian Keith | $158,730 |
Source: Public Records
Tax History Compared to Growth
Tax History
| Year | Tax Paid | Tax Assessment Tax Assessment Total Assessment is a certain percentage of the fair market value that is determined by local assessors to be the total taxable value of land and additions on the property. | Land | Improvement |
|---|---|---|---|---|
| 2025 | $966 | $84,429 | $19,603 | $64,826 |
| 2024 | $966 | $82,774 | $19,219 | $63,555 |
| 2023 | $942 | $81,152 | $18,843 | $62,309 |
| 2022 | $915 | $79,562 | $18,474 | $61,088 |
| 2021 | $908 | $78,003 | $18,112 | $59,891 |
| 2020 | $896 | $77,204 | $17,927 | $59,277 |
| 2019 | $879 | $75,691 | $17,576 | $58,115 |
| 2018 | $4,503 | $387,600 | $163,200 | $224,400 |
| 2017 | $883 | $72,754 | $16,895 | $55,859 |
| 2016 | $785 | $71,328 | $16,564 | $54,764 |
| 2015 | $773 | $70,258 | $16,316 | $53,942 |
| 2014 | $760 | $68,883 | $15,997 | $52,886 |
Source: Public Records
Map
Nearby Homes
- 4895 Bunnell St
- 312 S 49th St
- 325 Gloria St
- 237 S Willie James Jones Ave
- 5033 La Paz Dr
- 635 S 47th St Unit 37
- 222 50th St
- 5211 Trinidad Way
- 239 50th St Unit 33
- 229 50th St Unit 20
- 5017 Reynolds St
- 5270 San Bernardo Terrace
- 5140 Castana St
- 745 West St
- 247 Euclid Ave
- 812 West St
- 1370 Wyconda Way
- 5051 Pelusa St
- 4547 Imperial Ave
- 5236-38 Imperial Ave
- 4941 Ocean View Blvd
- 4921 Ocean View Blvd
- 4932 Bunnell St
- 4942 Bunnell St
- 4911 Ocean View Blvd
- 4952 Bunnell St
- 4922 Bunnell St
- 4951 Ocean View Blvd
- 4962 Bunnell St
- 4912 Bunnell St
- 436 S Willie James Jones Ave
- 4901 Ocean View Blvd
- 4965 Ocean View Blvd
- 4902 Bunnell St
- 4972 Bunnell St
- 4897 Ocean View Blvd
- 4910 Ocean View Blvd Unit 20
- 4933 Bunnell St
- 4982 Bunnell St
- 430 S Willie James Jones Ave