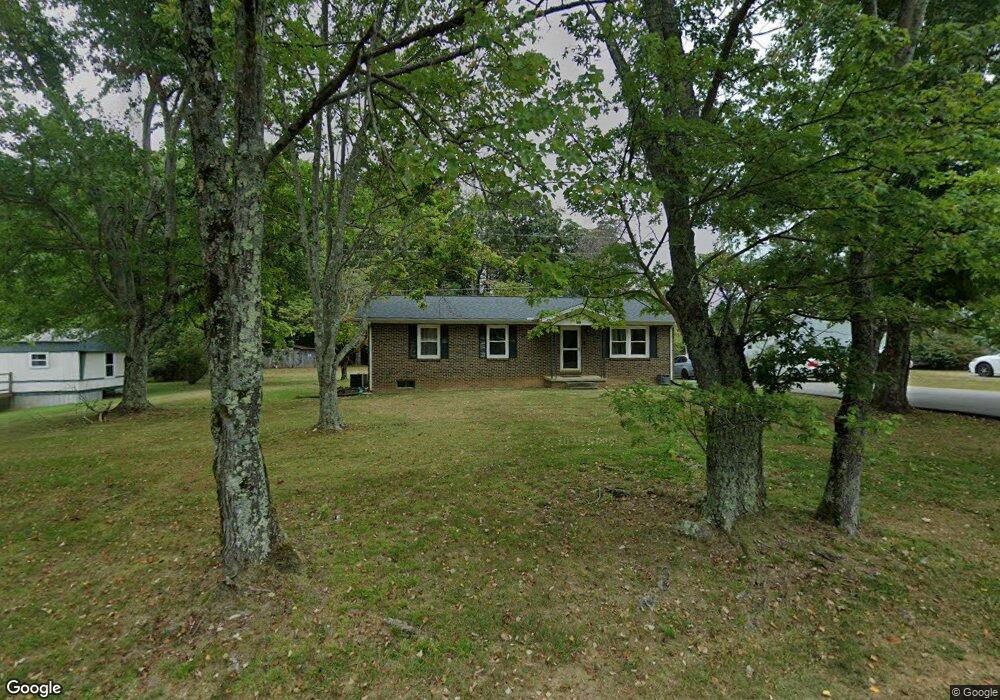
4931 Penthouse Rd Cookeville, TN 38506
Estimated Value: $213,176 - $311,000
--
Bed
1
Bath
1,150
Sq Ft
$215/Sq Ft
Est. Value
About This Home
This home is located at 4931 Penthouse Rd, Cookeville, TN 38506 and is currently estimated at $247,794, approximately $215 per square foot. 4931 Penthouse Rd is a home located in Putnam County with nearby schools including Cookeville High School, Algood Middle School, and Northeast Elementary School.
Ownership History
Date
Name
Owned For
Owner Type
Purchase Details
Closed on
Mar 17, 2025
Sold by
Sally Ann Massie Testamentary Trust and Massie Michael Lynn
Bought by
Massie Spencer Alexander
Current Estimated Value
Purchase Details
Closed on
Jun 1, 2021
Sold by
Massie Sally Ann
Bought by
Sally Ann Massie Testamentary Trust and Massie
Purchase Details
Closed on
Aug 29, 2020
Sold by
Massie Sally Ann and Massie William R
Bought by
Massie Michael Lynn and Ann Massie Testamentary Trust
Purchase Details
Closed on
Jul 27, 2004
Sold by
Rice Mark L and Rice Katrina L
Bought by
Brenda Bice
Purchase Details
Closed on
Sep 15, 1995
Sold by
Christell Staggs
Bought by
Massie William R
Purchase Details
Closed on
Oct 14, 1971
Bought by
Massie William and Massie Sally A
Purchase Details
Closed on
Apr 30, 1971
Purchase Details
Closed on
Mar 9, 1971
Create a Home Valuation Report for This Property
The Home Valuation Report is an in-depth analysis detailing your home's value as well as a comparison with similar homes in the area
Home Values in the Area
Average Home Value in this Area
Purchase History
| Date | Buyer | Sale Price | Title Company |
|---|---|---|---|
| Massie Spencer Alexander | -- | None Listed On Document | |
| Massie Spencer Alexander | -- | None Listed On Document | |
| Sally Ann Massie Testamentary Trust | -- | None Listed On Document | |
| Massie Michael Lynn | -- | None Available | |
| Brenda Bice | $63,000 | -- | |
| Massie William R | $1,500 | -- | |
| Massie William | -- | -- | |
| -- | -- | -- | |
| -- | -- | -- |
Source: Public Records
Tax History Compared to Growth
Tax History
| Year | Tax Paid | Tax Assessment Tax Assessment Total Assessment is a certain percentage of the fair market value that is determined by local assessors to be the total taxable value of land and additions on the property. | Land | Improvement |
|---|---|---|---|---|
| 2024 | $749 | $28,150 | $5,575 | $22,575 |
| 2023 | $749 | $28,150 | $5,575 | $22,575 |
| 2022 | $696 | $28,150 | $5,575 | $22,575 |
| 2021 | $737 | $28,150 | $5,575 | $22,575 |
| 2020 | $601 | $29,825 | $7,250 | $22,575 |
| 2019 | $601 | $20,525 | $5,250 | $15,275 |
| 2018 | $560 | $20,525 | $5,250 | $15,275 |
| 2017 | $560 | $20,525 | $5,250 | $15,275 |
| 2016 | $560 | $20,525 | $5,250 | $15,275 |
| 2015 | $576 | $20,525 | $5,250 | $15,275 |
| 2014 | $586 | $20,876 | $0 | $0 |
Source: Public Records
Map
Nearby Homes
- 4925 Penthouse Rd
- 5000 Village Rd
- 4920 Penthouse Rd
- 4952 Penthouse Rd
- 5012 Village Rd
- 5024 Village Rd
- 4998 Village Rd
- 5036 Village Rd
- 4970 Village Rd
- 4985 N Penthouse Dr
- 5070 Village Rd
- 4950 Village Rd
- 5000 Penthouse Rd
- 4993 Penthouse Rd
- 5035 Village Rd
- 4898 Village Rd
- 5009 Village Rd
- 4899 Village Rd
- 426 Mahan Rd
- 5001 Penthouse Rd