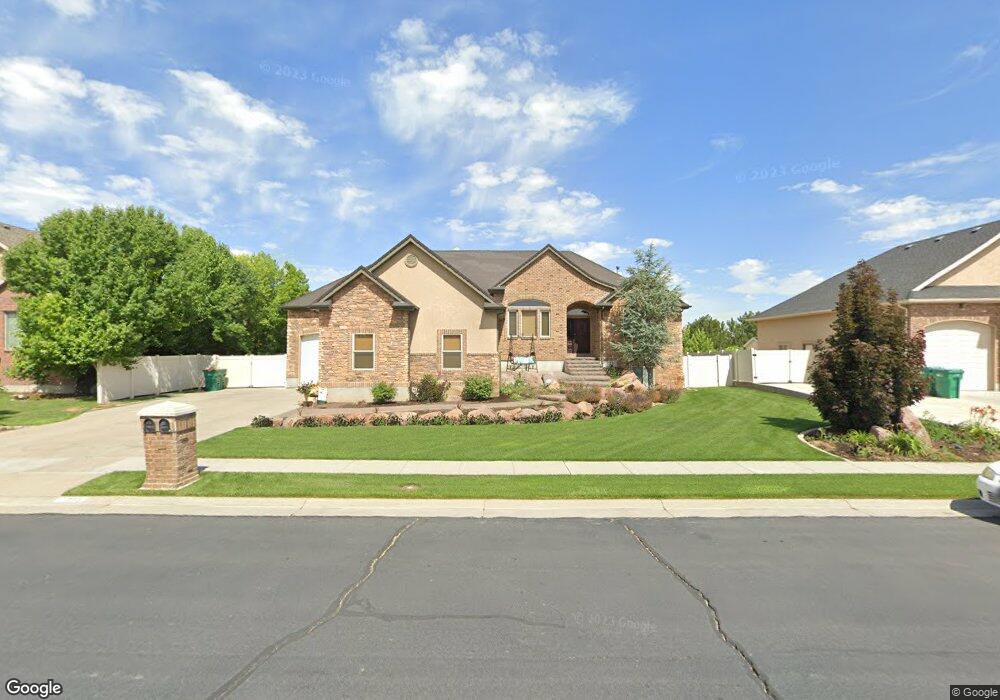
4931 S 5400 W Hooper, UT 84315
Estimated Value: $691,169 - $742,000
3
Beds
3
Baths
2,134
Sq Ft
$332/Sq Ft
Est. Value
About This Home
This home is located at 4931 S 5400 W, Hooper, UT 84315 and is currently estimated at $708,042, approximately $331 per square foot. 4931 S 5400 W is a home located in Weber County with nearby schools including Hooper Elementary School, Rocky Mountain Junior High School, and Fremont High School.
Ownership History
Date
Name
Owned For
Owner Type
Purchase Details
Closed on
Dec 15, 2004
Sold by
Haws Development Corp
Bought by
Ball Tracy and Ball Kirsten
Current Estimated Value
Create a Home Valuation Report for This Property
The Home Valuation Report is an in-depth analysis detailing your home's value as well as a comparison with similar homes in the area
Home Values in the Area
Average Home Value in this Area
Purchase History
| Date | Buyer | Sale Price | Title Company |
|---|---|---|---|
| Ball Tracy | -- | Hickman Land Title |
Source: Public Records
Tax History Compared to Growth
Tax History
| Year | Tax Paid | Tax Assessment Tax Assessment Total Assessment is a certain percentage of the fair market value that is determined by local assessors to be the total taxable value of land and additions on the property. | Land | Improvement |
|---|---|---|---|---|
| 2025 | $3,953 | $689,493 | $226,242 | $463,251 |
| 2024 | $3,807 | $371,799 | $124,433 | $247,366 |
| 2023 | $3,984 | $385,550 | $123,792 | $261,758 |
| 2022 | $3,778 | $374,000 | $101,387 | $272,613 |
| 2021 | $3,398 | $567,000 | $118,896 | $448,104 |
| 2020 | $3,114 | $476,000 | $98,745 | $377,255 |
| 2019 | $3,134 | $453,000 | $98,056 | $354,944 |
| 2018 | $3,060 | $423,000 | $77,906 | $345,094 |
| 2017 | $2,876 | $385,000 | $76,550 | $308,450 |
| 2016 | $2,783 | $201,169 | $36,907 | $164,262 |
| 2015 | $2,602 | $211,113 | $38,543 | $172,570 |
| 2014 | $2,622 | $181,648 | $30,271 | $151,377 |
Source: Public Records
Map
Nearby Homes
- 3729 S 5600 W Unit 6
- 3720 S 5600 W Unit 2
- 3719 S 5600 W Unit 7
- 4879 S 5050 W
- 5947 W 4600 S
- 5335 W 5500 S
- 3191 S 5100 St W Unit 1
- 4931 S 4700 W
- 6014 W 5300 S
- 6036 W 4700 S
- 4146 S 5800 W Unit 5
- 4163 S 5800 W Unit 2
- 0 W 5500 S
- 4111 S 5350 W
- 5160 W 5725 S
- 4556 W 4950 S
- 4700 W 5500 S
- 4126 S 4950 W
- 4449 W 5325 S
- 4909 W 5850 S