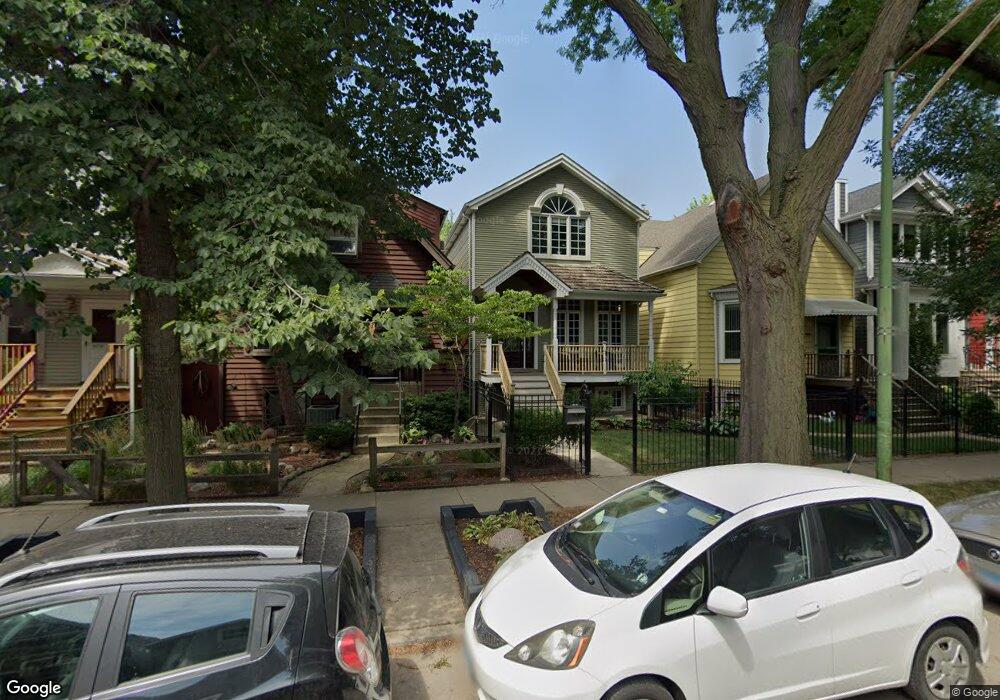
4932 N Seeley Ave Chicago, IL 60625
Ravenswood NeighborhoodEstimated Value: $1,389,042 - $1,787,000
4
Beds
4
Baths
4,100
Sq Ft
$388/Sq Ft
Est. Value
About This Home
This home is located at 4932 N Seeley Ave, Chicago, IL 60625 and is currently estimated at $1,591,761, approximately $388 per square foot. 4932 N Seeley Ave is a home located in Cook County with nearby schools including McPherson Elementary School, Amundsen High School, and Lycee Francais de Chicago.
Ownership History
Date
Name
Owned For
Owner Type
Purchase Details
Closed on
Aug 5, 2011
Sold by
Heuvel Patrick Vanden and Vanden Heuvel Jodi K
Bought by
Scrivner Thomas and Scrivner Colleen
Current Estimated Value
Home Financials for this Owner
Home Financials are based on the most recent Mortgage that was taken out on this home.
Original Mortgage
$660,000
Outstanding Balance
$458,463
Interest Rate
4.64%
Mortgage Type
New Conventional
Estimated Equity
$1,133,298
Purchase Details
Closed on
Jul 28, 2004
Sold by
Crabbe Vincent R
Bought by
Vanden Heuvel Patrick Vanden and Vanden Heuvel Jodi K
Home Financials for this Owner
Home Financials are based on the most recent Mortgage that was taken out on this home.
Original Mortgage
$720,000
Interest Rate
4.62%
Mortgage Type
Unknown
Purchase Details
Closed on
Jul 31, 2003
Sold by
Harrison Gloria and Jordan Norman
Bought by
Crabbe Vincent R
Purchase Details
Closed on
Dec 18, 2001
Sold by
Jordan Elizabeth L
Bought by
Jordan Norman and Harrison Gloria
Home Financials for this Owner
Home Financials are based on the most recent Mortgage that was taken out on this home.
Original Mortgage
$200,000
Interest Rate
7%
Create a Home Valuation Report for This Property
The Home Valuation Report is an in-depth analysis detailing your home's value as well as a comparison with similar homes in the area
Home Values in the Area
Average Home Value in this Area
Purchase History
| Date | Buyer | Sale Price | Title Company |
|---|---|---|---|
| Scrivner Thomas | $870,000 | Chicago Title Insurance Co | |
| Vanden Heuvel Patrick Vanden | $899,000 | First American Title Ins Co | |
| Crabbe Vincent R | $329,000 | Pntn | |
| Jordan Norman | $267,000 | -- |
Source: Public Records
Mortgage History
| Date | Status | Borrower | Loan Amount |
|---|---|---|---|
| Open | Scrivner Thomas | $660,000 | |
| Previous Owner | Vanden Heuvel Patrick Vanden | $720,000 | |
| Previous Owner | Jordan Norman | $200,000 |
Source: Public Records
Tax History Compared to Growth
Tax History
| Year | Tax Paid | Tax Assessment Tax Assessment Total Assessment is a certain percentage of the fair market value that is determined by local assessors to be the total taxable value of land and additions on the property. | Land | Improvement |
|---|---|---|---|---|
| 2024 | $17,370 | $119,767 | $31,561 | $88,206 |
| 2023 | $16,912 | $85,644 | $25,376 | $60,268 |
| 2022 | $16,912 | $85,644 | $25,376 | $60,268 |
| 2021 | $16,552 | $85,643 | $25,376 | $60,267 |
| 2020 | $17,609 | $82,148 | $13,322 | $68,826 |
| 2019 | $18,316 | $94,594 | $13,322 | $81,272 |
| 2018 | $19,645 | $102,885 | $13,322 | $89,563 |
| 2017 | $17,858 | $86,330 | $11,419 | $74,911 |
| 2016 | $16,791 | $86,330 | $11,419 | $74,911 |
| 2015 | $17,169 | $96,319 | $11,419 | $84,900 |
| 2014 | $14,685 | $81,714 | $8,247 | $73,467 |
| 2013 | $14,383 | $81,714 | $8,247 | $73,467 |
Source: Public Records
Map
Nearby Homes
- 1949 W Argyle St Unit 19491
- 5015 N Damen Ave
- 4948 N Winchester Ave
- 4906 N Winchester Ave
- 4814 N Damen Ave Unit 209
- 5401-5447 N Wolcott Ave
- 4947 N Wolcott Ave Unit 1B
- 5013 N Wolcott Ave Unit 3W
- 4929 N Wolcott Ave Unit 1A
- 4909 N Wolcott Ave Unit 2B
- 2248 W Ainslie St
- 2201 W Winona St Unit 2201G
- 5117 N Winchester Ave Unit 2S
- 4726 N Winchester Ave Unit C
- 4726 N Winchester Ave Unit F
- 1776 W Winnemac Ave Unit 100
- 2135 W Leland Ave
- 1824 W Foster Ave Unit 302
- 5058 N Claremont Ave Unit 2E
- 2250 W Foster Ave Unit 2E
- 4934 N Seeley Ave
- 4934 N Seeley Ave Unit 2
- 4928 N Seeley Ave
- 4938 N Seeley Ave
- 4940 N Seeley Ave
- 4924 N Seeley Ave
- 4942 N Seeley Ave
- 4944 N Seeley Ave Unit 2
- 4944 N Seeley Ave
- 4918 N Seeley Ave
- 4933 N Hoyne Ave
- 4935 N Hoyne Ave
- 4927 N Hoyne Ave
- 4937 N Hoyne Ave
- 4946 N Seeley Ave
- 4916 N Seeley Ave
- 4931 N Hoyne Ave
- 4941 N Hoyne Ave
- 4933 N Seeley Ave
- 4950 N Seeley Ave Unit 2R