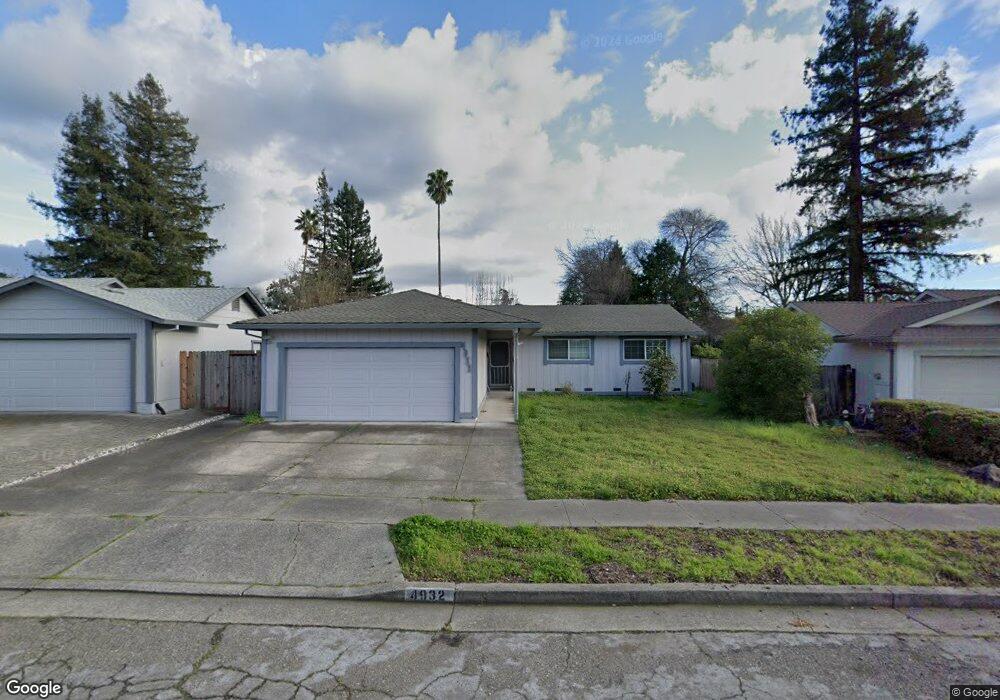
4932 Snark Ave Santa Rosa, CA 95409
Estimated Value: $612,000 - $690,000
3
Beds
2
Baths
1,248
Sq Ft
$522/Sq Ft
Est. Value
About This Home
This home is located at 4932 Snark Ave, Santa Rosa, CA 95409 and is currently estimated at $651,377, approximately $521 per square foot. 4932 Snark Ave is a home located in Sonoma County with nearby schools including Rincon Valley Middle School, Maria Carrillo High School, and Whited Elementary Charter School.
Ownership History
Date
Name
Owned For
Owner Type
Purchase Details
Closed on
May 2, 2007
Sold by
Vanoni Calvin R
Bought by
Vanoni Alicia L
Current Estimated Value
Home Financials for this Owner
Home Financials are based on the most recent Mortgage that was taken out on this home.
Original Mortgage
$340,000
Outstanding Balance
$206,473
Interest Rate
6.14%
Mortgage Type
New Conventional
Estimated Equity
$444,904
Purchase Details
Closed on
May 24, 2002
Sold by
Vanoni Calvin Ross and Vanoni Alicia Lynette
Bought by
Vanoni Calvin R and Vanoni Alicia L
Home Financials for this Owner
Home Financials are based on the most recent Mortgage that was taken out on this home.
Original Mortgage
$50,000
Interest Rate
6.89%
Mortgage Type
Credit Line Revolving
Purchase Details
Closed on
Jul 10, 1997
Sold by
Anglen Michael L
Bought by
Vanoni Calvin Ross and Sauer Alicia Lynette
Home Financials for this Owner
Home Financials are based on the most recent Mortgage that was taken out on this home.
Original Mortgage
$139,900
Interest Rate
7.83%
Create a Home Valuation Report for This Property
The Home Valuation Report is an in-depth analysis detailing your home's value as well as a comparison with similar homes in the area
Home Values in the Area
Average Home Value in this Area
Purchase History
| Date | Buyer | Sale Price | Title Company |
|---|---|---|---|
| Vanoni Alicia L | -- | Cornerstone Title Company | |
| Vanoni Calvin R | -- | New Century Title Co | |
| Vanoni Calvin Ross | $175,000 | North Bay Title Co |
Source: Public Records
Mortgage History
| Date | Status | Borrower | Loan Amount |
|---|---|---|---|
| Open | Vanoni Alicia L | $340,000 | |
| Closed | Vanoni Calvin R | $50,000 | |
| Closed | Vanoni Calvin Ross | $139,900 |
Source: Public Records
Tax History Compared to Growth
Tax History
| Year | Tax Paid | Tax Assessment Tax Assessment Total Assessment is a certain percentage of the fair market value that is determined by local assessors to be the total taxable value of land and additions on the property. | Land | Improvement |
|---|---|---|---|---|
| 2025 | $3,253 | $279,252 | $111,762 | $167,490 |
| 2024 | $3,253 | $273,777 | $109,571 | $164,206 |
| 2023 | $3,253 | $268,410 | $107,423 | $160,987 |
| 2022 | $3,003 | $263,148 | $105,317 | $157,831 |
| 2021 | $2,942 | $257,989 | $103,252 | $154,737 |
| 2020 | $2,931 | $255,345 | $102,194 | $153,151 |
| 2019 | $2,902 | $250,340 | $100,191 | $150,149 |
| 2018 | $2,882 | $245,432 | $98,227 | $147,205 |
| 2017 | $2,828 | $240,620 | $96,301 | $144,319 |
| 2016 | $2,790 | $235,903 | $94,413 | $141,490 |
| 2015 | $2,707 | $232,360 | $92,995 | $139,365 |
| 2014 | $2,608 | $227,810 | $91,174 | $136,636 |
Source: Public Records
Map
Nearby Homes
- 5015 Charmian Dr
- 311 Algiers Ct
- 416 Tanglewood Ct
- 5020 Roma St
- 5086 Charmian Dr
- 405 Simi Place
- 206 Indian Creek Dr
- 305 Simone Place N
- 4705 Culebra Way
- 4704 Venti Ln
- 324 Breeden St
- 5056 Fravel Ln
- Cottage 2 Plan at Acacia Village
- Two-Story Plan at Acacia Village
- Cottage 1 Plan at Acacia Village
- 537 Emerald Park Ct
- 5025 Parkhurst Dr
- 305 Hansbery Way
- 61 Coronado Cir
- 66 Coronado Cir
- 4938 Snark Ave
- 4928 Snark Ave
- 4929 Sea Wolf Dr
- 4942 Snark Ave
- 4924 Snark Ave
- 4925 Sea Wolf Dr
- 4933 Sea Wolf Dr
- 4933 Snark Ave
- 4929 Snark Ave
- 4937 Sea Wolf Dr
- 4921 Sea Wolf Dr
- 4937 Snark Ave
- 4946 Snark Ave
- 4925 Snark Ave
- 4922 Snark Ave
- 4941 Sea Wolf Dr
- 4941 Snark Ave
- 4917 Sea Wolf Dr
- 4921 Cheryl Ct
- 4950 Snark Ave