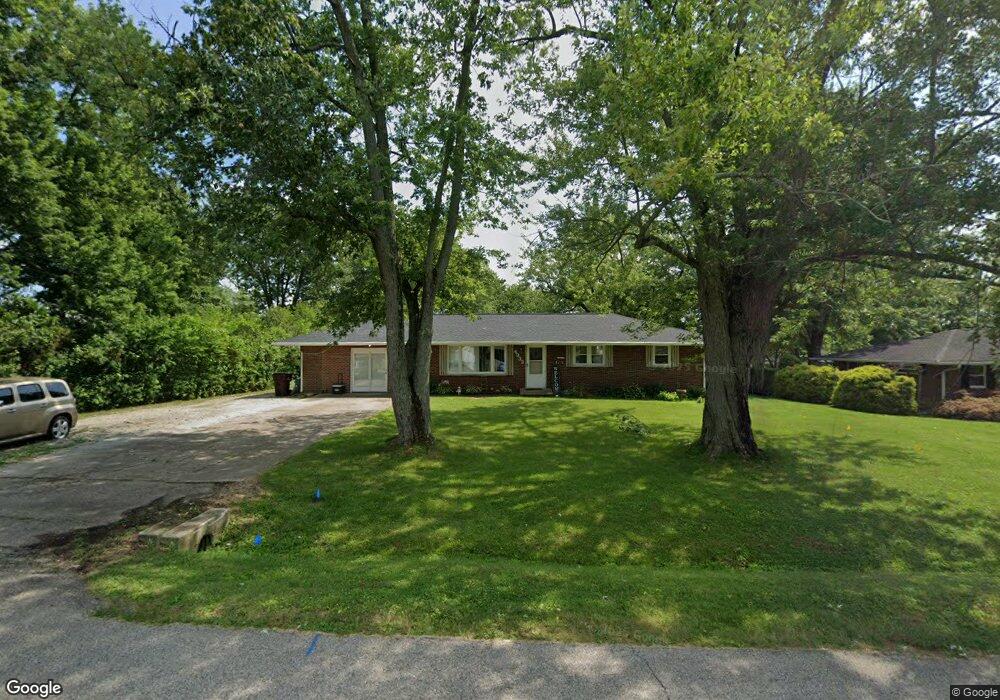
4933 Betsy Dr Franklin, OH 45005
Estimated Value: $240,018 - $275,000
3
Beds
1
Bath
1,625
Sq Ft
$161/Sq Ft
Est. Value
About This Home
This home is located at 4933 Betsy Dr, Franklin, OH 45005 and is currently estimated at $261,755, approximately $161 per square foot. 4933 Betsy Dr is a home located in Warren County with nearby schools including Franklin High School, Summit Academy Community School for Alternative Learners - Middletown, and Marshall High School.
Ownership History
Date
Name
Owned For
Owner Type
Purchase Details
Closed on
Mar 25, 2008
Sold by
Carter Jerry W and Wilson Carter Trina K
Bought by
Carter Jerry W and Wilson Carter Trina K
Current Estimated Value
Home Financials for this Owner
Home Financials are based on the most recent Mortgage that was taken out on this home.
Original Mortgage
$100,000
Interest Rate
6.1%
Mortgage Type
New Conventional
Purchase Details
Closed on
Jul 13, 1992
Sold by
Carter Carter and Carter Jerry W
Bought by
Carter Carter and Carter Jerry W
Purchase Details
Closed on
Feb 22, 1988
Sold by
Carter Carter and Carter Jerry W
Bought by
Carter Carter and Carter Jerry W
Purchase Details
Closed on
Mar 6, 1984
Sold by
Whaley Ronald G and Whaley Ronald G
Bought by
Carter and Carter Jerry W
Purchase Details
Closed on
Aug 4, 1978
Sold by
Cook Cook and Cook Robt D
Create a Home Valuation Report for This Property
The Home Valuation Report is an in-depth analysis detailing your home's value as well as a comparison with similar homes in the area
Home Values in the Area
Average Home Value in this Area
Purchase History
| Date | Buyer | Sale Price | Title Company |
|---|---|---|---|
| Carter Jerry W | -- | National Title Co | |
| Carter Carter | -- | -- | |
| Carter Carter | -- | -- | |
| Carter | $47,000 | -- | |
| -- | $39,500 | -- |
Source: Public Records
Mortgage History
| Date | Status | Borrower | Loan Amount |
|---|---|---|---|
| Closed | Carter Jerry W | $100,000 |
Source: Public Records
Tax History
| Year | Tax Paid | Tax Assessment Tax Assessment Total Assessment is a certain percentage of the fair market value that is determined by local assessors to be the total taxable value of land and additions on the property. | Land | Improvement |
|---|---|---|---|---|
| 2025 | $2,652 | $60,090 | $16,010 | $44,080 |
| 2024 | $2,652 | $60,090 | $16,010 | $44,080 |
| 2023 | $2,385 | $48,650 | $13,132 | $35,518 |
| 2022 | $2,631 | $48,650 | $13,132 | $35,518 |
| 2021 | $2,595 | $48,650 | $13,132 | $35,518 |
| 2020 | $2,434 | $39,550 | $10,675 | $28,875 |
| 2019 | $2,232 | $39,550 | $10,675 | $28,875 |
| 2018 | $1,830 | $39,550 | $10,675 | $28,875 |
| 2017 | $2,122 | $33,852 | $9,261 | $24,591 |
| 2016 | $2,162 | $33,852 | $9,261 | $24,591 |
| 2015 | $2,165 | $33,852 | $9,261 | $24,591 |
| 2014 | $1,724 | $32,240 | $8,820 | $23,420 |
| 2013 | $1,465 | $39,010 | $10,680 | $28,330 |
Source: Public Records
Map
Nearby Homes
- 5019 Betsy Dr
- 3635 Julie Dr
- 3833 Sterling Dr
- 4689 Fisher Rd
- 5100 Renaissance Park Dr
- 5139 Renaissance Park Dr
- 3466 Renaissance Ct
- 4385 Harvest Ln
- 5284 Othello Dr
- 5302 Othello Dr
- 4458 Rose Marie Rd
- 5482 Sheldon Close
- 5200 Long Meadow Dr
- 5371 Sheldon Close
- 3048 Canvasback Ct
- 5324 Donatello Dr
- 3412 State Route 122
- 3644 Connie Dr
- 3545 Robinson Vail Rd
- 4640 Shaker Rd
- 4917 Betsy Dr
- 4951 Betsy Dr
- 4901 Betsy Dr
- 4971 Betsy Dr
- 4964 State Route 122
- 4930 State Route 122
- 4946 State Route 122
- 4934 Betsy Dr
- 4883 Betsy Dr
- 4984 State Route 122
- 4924 State Route 122
- 4918 Betsy Dr
- 4952 Betsy Dr
- 4902 Betsy Dr
- 4972 Betsy Dr
- 3554 Julie Dr
- 5002 State Route 122
- 4892 State Route 122
- 4863 Betsy Dr
- 4882 Betsy Dr
Your Personal Tour Guide
Ask me questions while you tour the home.