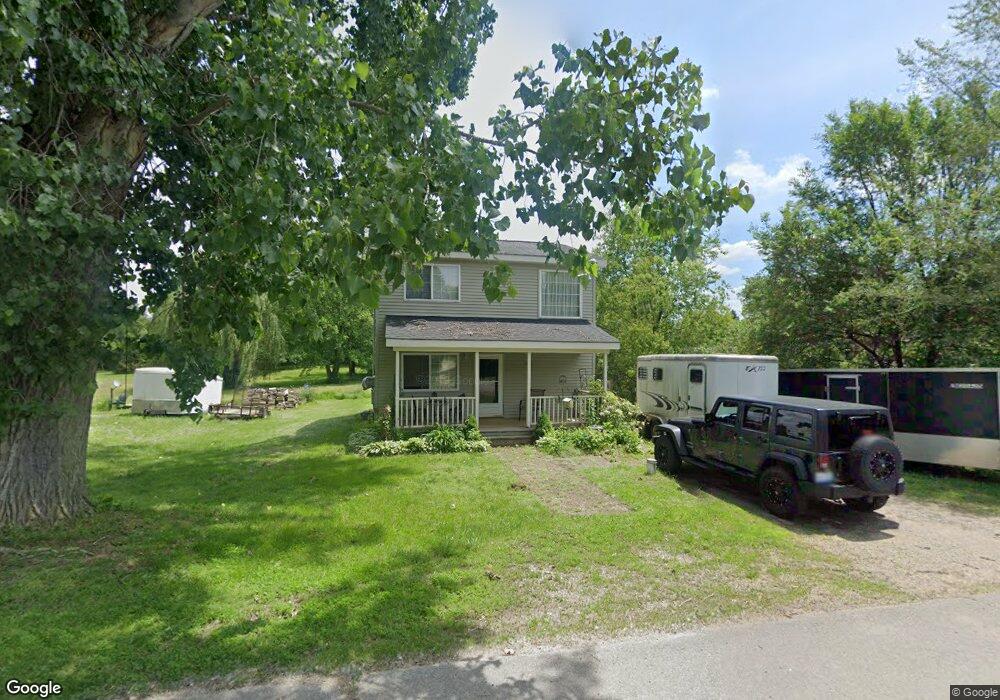
4933 Deleon Dr Unit De Leon Tecumseh, MI 49286
Estimated Value: $111,000 - $233,000
2
Beds
1
Bath
1,152
Sq Ft
$147/Sq Ft
Est. Value
About This Home
This home is located at 4933 Deleon Dr Unit De Leon, Tecumseh, MI 49286 and is currently estimated at $169,302, approximately $146 per square foot. 4933 Deleon Dr Unit De Leon is a home located in Lenawee County with nearby schools including Tecumseh Middle School and Tecumseh High School.
Ownership History
Date
Name
Owned For
Owner Type
Purchase Details
Closed on
Jan 23, 2017
Sold by
Capps Michael H
Bought by
Capps Michael H and Narsesian Kimberly A
Current Estimated Value
Purchase Details
Closed on
Nov 8, 2011
Sold by
United Bank & Trust
Bought by
Capps Michael H
Purchase Details
Closed on
Nov 3, 2011
Sold by
Fannie Mae
Bought by
United Bank & Trust
Purchase Details
Closed on
Sep 15, 2008
Sold by
United Mortgage Co
Bought by
Federal National Mortgage Association
Purchase Details
Closed on
Sep 11, 2008
Sold by
Clarke Lowell R and Clarke Nicole G
Bought by
United Mortgage Co
Purchase Details
Closed on
Nov 30, 2006
Sold by
Rumler John G and Rumler Dawn R
Bought by
Clarke Lowell R and Clarke Nicole G
Home Financials for this Owner
Home Financials are based on the most recent Mortgage that was taken out on this home.
Original Mortgage
$87,720
Interest Rate
6.33%
Mortgage Type
New Conventional
Create a Home Valuation Report for This Property
The Home Valuation Report is an in-depth analysis detailing your home's value as well as a comparison with similar homes in the area
Home Values in the Area
Average Home Value in this Area
Purchase History
| Date | Buyer | Sale Price | Title Company |
|---|---|---|---|
| Capps Michael H | -- | None Available | |
| Capps Michael H | $20,000 | Atcl | |
| United Bank & Trust | -- | None Available | |
| Federal National Mortgage Association | -- | None Available | |
| United Mortgage Co | $92,587 | None Available | |
| Clarke Lowell R | $87,500 | American Title Insurance Co |
Source: Public Records
Mortgage History
| Date | Status | Borrower | Loan Amount |
|---|---|---|---|
| Previous Owner | Clarke Lowell R | $87,720 |
Source: Public Records
Tax History
| Year | Tax Paid | Tax Assessment Tax Assessment Total Assessment is a certain percentage of the fair market value that is determined by local assessors to be the total taxable value of land and additions on the property. | Land | Improvement |
|---|---|---|---|---|
| 2025 | $1,088 | $66,100 | $0 | $0 |
| 2024 | $7 | $64,800 | $0 | $0 |
| 2023 | $1,038 | $58,000 | $0 | $0 |
| 2022 | $1,026 | $51,500 | $0 | $0 |
| 2021 | $1,132 | $47,900 | $0 | $0 |
| 2020 | $1,747 | $44,700 | $0 | $0 |
| 2019 | $1,818 | $38,000 | $0 | $0 |
| 2018 | $1,780 | $38,038 | $0 | $0 |
| 2017 | $1,729 | $36,938 | $0 | $0 |
| 2016 | $1,702 | $34,775 | $0 | $0 |
| 2014 | -- | $31,789 | $0 | $0 |
Source: Public Records
Map
Nearby Homes
- 5517 Billmyer Hwy
- 6111 Billmyer Hwy
- 1066 Preservation Dr
- 3125 N Rogers Hwy
- 1036 Preservation Dr
- 6584 Holloway Rd
- 4615 Green Hwy
- 799 War Bonnet Dr
- 6768 Shull Rd
- 700 E Russell Rd
- 809 Blood Rd
- 3346 Saxony Dr N
- 7484 Billmyer Hwy
- 3324 Sutton Rd
- 3284 Sutton Rd
- 820 Waskin Dr
- 816 Waskin Dr
- 800 Waskin Dr
- 6000 Occidental Hwy Unit 6000 Blk Occidental
- 2901 Gady Rd
- 4933 Deleon Dr
- 4921 Deleon Dr
- 4947 Deleon Dr
- 4922 Deleon Dr
- 4948 Deleon Dr
- 4959 Deleon Dr
- 4908 Deleon Dr
- 4973 Deleon Dr
- 4973 Deleon Dr Unit DE LEON
- 4881 Deleon Dr
- 4882 Deleon Dr
- 4987 Pocklington Rd
- 4865 Deleon Dr
- 4860 Deleon Dr
- 4855 Deleon Dr
- 4856 Deleon Dr
- 4839 Deleon Dr
- 4839 Deleon Dr
- 4839 Deleon Dr
- 4832 Deleon Dr
Your Personal Tour Guide
Ask me questions while you tour the home.