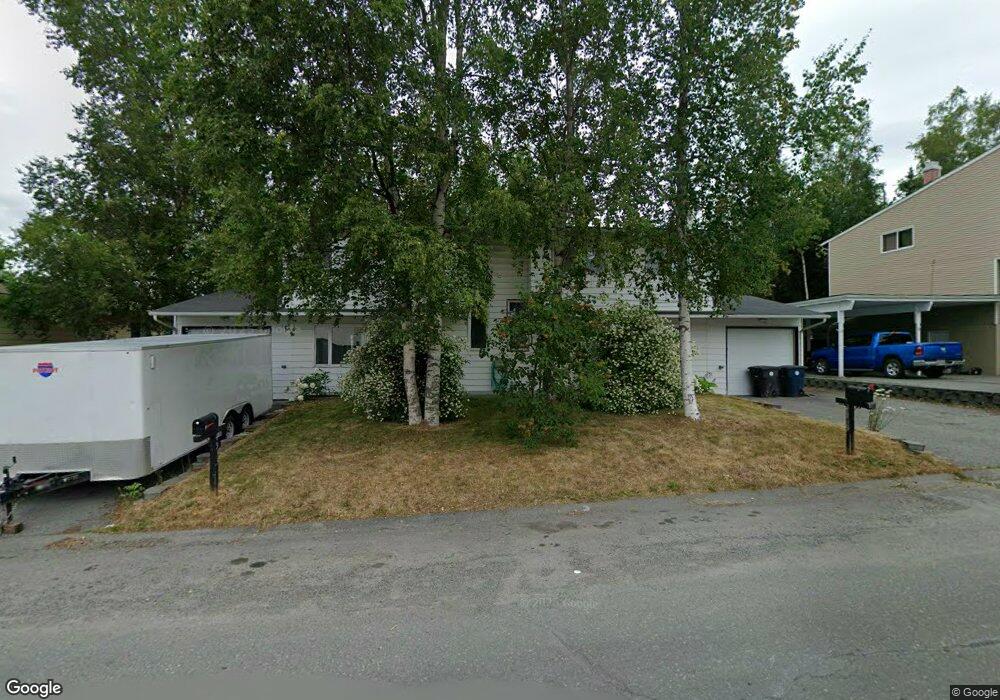
4933 E 43rd Ave Anchorage, AK 99508
University Area NeighborhoodEstimated Value: $178,000 - $607,000
6
Beds
4
Baths
2,284
Sq Ft
$187/Sq Ft
Est. Value
About This Home
This home is located at 4933 E 43rd Ave, Anchorage, AK 99508 and is currently estimated at $426,580, approximately $186 per square foot. 4933 E 43rd Ave is a home located in Anchorage Municipality with nearby schools including College Gate Elementary School, Wendler Middle School, and Bettye Davis East Anchorage High School.
Ownership History
Date
Name
Owned For
Owner Type
Purchase Details
Closed on
Jan 8, 2013
Sold by
Doogan Jason W and Doogan Jason W
Bought by
Doogan Janel and Doogan Jason W
Current Estimated Value
Purchase Details
Closed on
May 13, 2003
Sold by
Garrett Kathleen L
Bought by
Doogan Jason W
Purchase Details
Closed on
Oct 12, 1998
Sold by
Fortney Mary E
Bought by
Garrett Kathleen L
Create a Home Valuation Report for This Property
The Home Valuation Report is an in-depth analysis detailing your home's value as well as a comparison with similar homes in the area
Home Values in the Area
Average Home Value in this Area
Purchase History
| Date | Buyer | Sale Price | Title Company |
|---|---|---|---|
| Doogan Janel | -- | Stewart Title Company | |
| Doogan Jason W | -- | -- | |
| Garrett Kathleen L | -- | -- | |
| Garrett Kathleen L | -- | -- |
Source: Public Records
Mortgage History
| Date | Status | Borrower | Loan Amount |
|---|---|---|---|
| Closed | Garrett Kathleen L | $0 |
Source: Public Records
Tax History
| Year | Tax Paid | Tax Assessment Tax Assessment Total Assessment is a certain percentage of the fair market value that is determined by local assessors to be the total taxable value of land and additions on the property. | Land | Improvement |
|---|---|---|---|---|
| 2025 | $6,862 | $484,100 | $111,700 | $372,400 |
| 2024 | $6,862 | $425,000 | $111,700 | $313,300 |
| 2023 | $6,798 | $399,200 | $111,700 | $287,500 |
| 2022 | $6,264 | $372,000 | $111,700 | $260,300 |
| 2021 | $6,130 | $340,200 | $111,700 | $228,500 |
| 2020 | $5,794 | $340,800 | $111,700 | $229,100 |
| 2019 | $5,566 | $340,200 | $111,700 | $228,500 |
| 2018 | $4,871 | $347,000 | $113,000 | $234,000 |
| 2017 | $5,257 | $355,700 | $107,200 | $248,500 |
| 2016 | $4,135 | $349,200 | $107,200 | $242,000 |
| 2015 | $4,135 | $332,600 | $97,800 | $234,800 |
| 2014 | $4,135 | $317,200 | $91,200 | $226,000 |
Source: Public Records
Map
Nearby Homes
- 3821 Checkmate Dr
- 4109 Lynn Dr Unit 204
- 4109 Lynn Dr Unit 101
- 5618 E 40th Ave Unit C102
- 5642 E 40th Ave Unit G203
- 3591 Lynn Dr Unit 1
- 3680 Little Bear Place Unit 8
- 5561 Big Bear Way Unit 25
- 3664 Mirage Cir
- 5507 E 34th Ave Unit 104
- 6010 Longoria Cir
- 3973 Defiance St
- 4768 Mills Dr Unit 42
- 3208 Eastgate Place Unit 4
- 3209 Eastgate Place Unit 104
- 6245 E Tudor Rd Unit 16
- 000 Wesleyan Dr
- 3530 E 42nd Ave
- 6251 E 41st Ct Unit 115
- 5553 College Meadow Cir
- 4945 E 43rd Ave
- 4925 E 43rd Ave Unit 16
- 4925 E 43rd Ave
- 4143 Lana Ct
- 4923 E 43rd Ave Unit 15
- 4138 Lana Ct
- 4957 E 43rd Ave
- 4955 E 43rd Ave
- 4907 E 43rd Ave
- 4229 Rollins Dr
- 4137 Lana Ct
- 4217 Rollins Dr
- 4130 Lana Ct
- 4128 Lana Ct
- 4240 Chess Dr
- 4228 Chess Dr
- 4203 Rollins Dr
- 4129 Lana Ct
- 4212 Chess Dr
- 4205 Rollins Dr
Your Personal Tour Guide
Ask me questions while you tour the home.