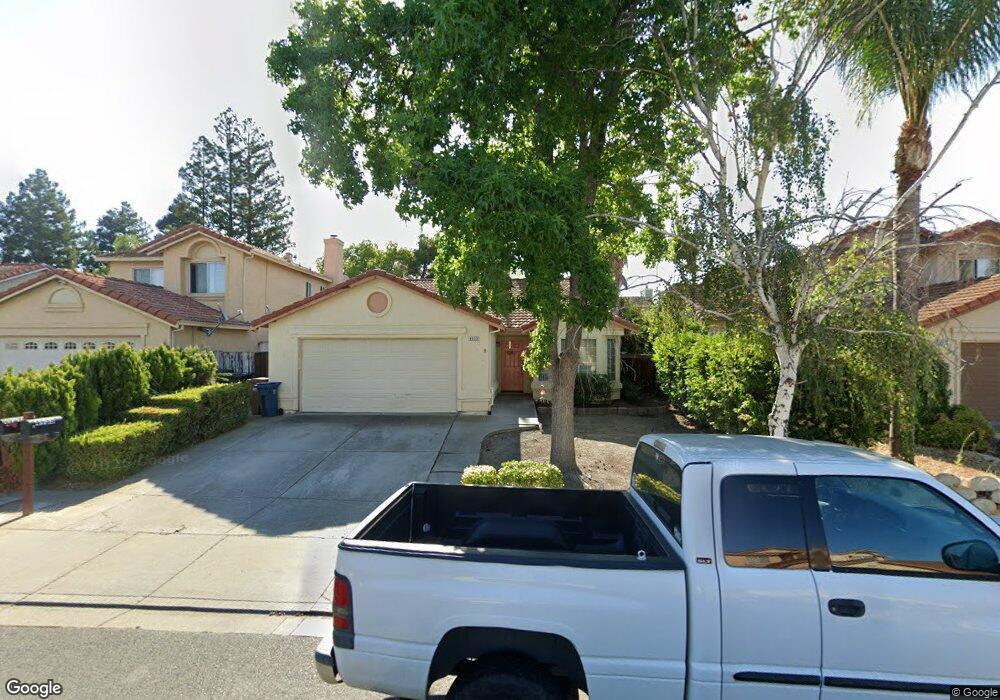
4933 Lefebvre Way Antioch, CA 94531
Country Hills NeighborhoodEstimated Value: $529,140 - $565,000
3
Beds
2
Baths
1,317
Sq Ft
$416/Sq Ft
Est. Value
About This Home
This home is located at 4933 Lefebvre Way, Antioch, CA 94531 and is currently estimated at $548,285, approximately $416 per square foot. 4933 Lefebvre Way is a home located in Contra Costa County with nearby schools including Carmen Dragon Elementary School, Black Diamond Middle School, and Deer Valley High School.
Ownership History
Date
Name
Owned For
Owner Type
Purchase Details
Closed on
Apr 26, 2002
Sold by
Parvez Abdul Samad
Bought by
Fazli Mustafe
Current Estimated Value
Purchase Details
Closed on
Mar 13, 2002
Sold by
Aryen Mezhgan and Fazli Mustafa
Bought by
Fazli Mustafa
Purchase Details
Closed on
May 30, 1997
Sold by
Va
Bought by
Parvez Abdul S and Fazli Mezhgan M
Home Financials for this Owner
Home Financials are based on the most recent Mortgage that was taken out on this home.
Original Mortgage
$143,050
Interest Rate
7.98%
Mortgage Type
Seller Take Back
Purchase Details
Closed on
Nov 1, 1996
Sold by
Boyer Clancy G and Boyer Kathleen M
Bought by
First Nationwide Mtg Partnership Lp
Purchase Details
Closed on
Oct 28, 1996
Sold by
First Nationwide Mtg Partnership
Bought by
Va
Purchase Details
Closed on
Nov 23, 1994
Sold by
Boyer Clancy G and Boyer Kathleen M
Bought by
Jessurun Harold and Jessurun Johanna
Create a Home Valuation Report for This Property
The Home Valuation Report is an in-depth analysis detailing your home's value as well as a comparison with similar homes in the area
Home Values in the Area
Average Home Value in this Area
Purchase History
| Date | Buyer | Sale Price | Title Company |
|---|---|---|---|
| Fazli Mustafe | -- | -- | |
| Fazli Mustafa | -- | -- | |
| Parvez Abdul S | $145,000 | -- | |
| First Nationwide Mtg Partnership Lp | $107,895 | American Title Ins Co | |
| Va | -- | North American Title Co | |
| Jessurun Harold | -- | Old Republic Title Company |
Source: Public Records
Mortgage History
| Date | Status | Borrower | Loan Amount |
|---|---|---|---|
| Previous Owner | Parvez Abdul S | $143,050 |
Source: Public Records
Tax History
| Year | Tax Paid | Tax Assessment Tax Assessment Total Assessment is a certain percentage of the fair market value that is determined by local assessors to be the total taxable value of land and additions on the property. | Land | Improvement |
|---|---|---|---|---|
| 2025 | $4,725 | $392,199 | $155,103 | $237,096 |
| 2024 | $4,442 | $384,510 | $152,062 | $232,448 |
| 2023 | $4,442 | $376,972 | $149,081 | $227,891 |
| 2022 | $4,375 | $369,581 | $146,158 | $223,423 |
| 2021 | $4,243 | $362,336 | $143,293 | $219,043 |
| 2019 | $4,144 | $351,591 | $139,044 | $212,547 |
| 2018 | $3,994 | $344,698 | $136,318 | $208,380 |
| 2017 | $3,910 | $337,941 | $133,646 | $204,295 |
| 2016 | $3,682 | $318,500 | $125,958 | $192,542 |
| 2015 | $3,439 | $277,000 | $109,545 | $167,455 |
| 2014 | $3,891 | $263,000 | $104,009 | $158,991 |
Source: Public Records
Map
Nearby Homes
- 4804 Lefebvre Way
- 5019 Fernbank Way
- 5121 Rodeo Ct
- 5037 Bronco Ct
- 5121 Deerspring Way
- 4916 Willowbrook Way
- 4672 Copper Hill Ct
- 4671 Copper Hill Ct
- 5104 Carriage Way
- 5067 Prairie Way
- 5209 Berrydale Way
- 4855 Greencastle Way
- 4653 Arabian Way
- 4750 Sterling Hill Dr
- 5249 Clydesdale Way
- 4651 Shetland Way
- 5114 Homestead Ct
- 5052 Perry Way
- 5000 Morgan Way
- 5447 Benttree Way
- 4929 Lefebvre Way
- 4937 Lefebvre Way
- 4925 Lefebvre Way
- 4941 Lefebvre Way
- 5017 Woodmont Way
- 5021 Woodmont Way
- 5013 Woodmont Way
- 4945 Lefebvre Way
- 4921 Lefebvre Way
- 4930 Lefebvre Way
- 4936 Lefebvre Way
- 4926 Lefebvre Way
- 4940 Lefebvre Way
- 4949 Lefebvre Way
- 5029 Woodmont Way
- 4917 Lefebvre Way
- 4922 Lefebvre Way
- 4944 Lefebvre Way
- 4918 Lefebvre Way
- 4953 Lefebvre Way
Your Personal Tour Guide
Ask me questions while you tour the home.