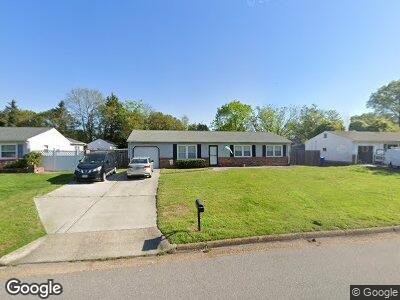
4936 Locke Ln Virginia Beach, VA 23464
Estimated Value: $370,000 - $404,534
3
Beds
2
Baths
1,750
Sq Ft
$222/Sq Ft
Est. Value
About This Home
This home is located at 4936 Locke Ln, Virginia Beach, VA 23464 and is currently estimated at $388,134, approximately $221 per square foot. 4936 Locke Ln is a home located in Virginia Beach City with nearby schools including Kempsville Elementary School, Kempsville Middle School, and Kempsville High School.
Ownership History
Date
Name
Owned For
Owner Type
Purchase Details
Closed on
Feb 20, 2024
Sold by
Monroe John W and Monroe Anita L
Bought by
Pearston Aaron
Current Estimated Value
Home Financials for this Owner
Home Financials are based on the most recent Mortgage that was taken out on this home.
Original Mortgage
$365,000
Outstanding Balance
$361,444
Interest Rate
6.75%
Mortgage Type
New Conventional
Estimated Equity
$15,185
Purchase Details
Closed on
Oct 26, 2007
Sold by
Sheldon Scott L
Bought by
Monroe John W
Home Financials for this Owner
Home Financials are based on the most recent Mortgage that was taken out on this home.
Original Mortgage
$280,000
Interest Rate
6.39%
Mortgage Type
New Conventional
Purchase Details
Closed on
Aug 7, 2003
Sold by
Akers Paula
Bought by
Sheldon Scott
Home Financials for this Owner
Home Financials are based on the most recent Mortgage that was taken out on this home.
Original Mortgage
$151,742
Interest Rate
5.28%
Mortgage Type
New Conventional
Create a Home Valuation Report for This Property
The Home Valuation Report is an in-depth analysis detailing your home's value as well as a comparison with similar homes in the area
Home Values in the Area
Average Home Value in this Area
Purchase History
| Date | Buyer | Sale Price | Title Company |
|---|---|---|---|
| Pearston Aaron | $365,000 | Fidelity National Title Insura | |
| Monroe John W | $280,000 | -- | |
| Sheldon Scott | $149,500 | -- |
Source: Public Records
Mortgage History
| Date | Status | Borrower | Loan Amount |
|---|---|---|---|
| Open | Pearston Aaron | $365,000 | |
| Previous Owner | Monroe John W | $282,998 | |
| Previous Owner | Monroe John W | $280,000 | |
| Previous Owner | Sheldon Scott | $151,742 |
Source: Public Records
Tax History Compared to Growth
Tax History
| Year | Tax Paid | Tax Assessment Tax Assessment Total Assessment is a certain percentage of the fair market value that is determined by local assessors to be the total taxable value of land and additions on the property. | Land | Improvement |
|---|---|---|---|---|
| 2024 | $2,761 | $284,600 | $155,000 | $129,600 |
| 2023 | $2,466 | $249,100 | $113,000 | $136,100 |
| 2022 | $2,342 | $236,600 | $107,000 | $129,600 |
| 2021 | $2,280 | $230,300 | $105,000 | $125,300 |
| 2020 | $2,323 | $228,300 | $105,000 | $123,300 |
| 2019 | $2,250 | $217,900 | $105,000 | $112,900 |
| 2018 | $2,184 | $217,900 | $105,000 | $112,900 |
| 2017 | $2,092 | $208,700 | $100,100 | $108,600 |
| 2016 | $2,057 | $207,800 | $100,100 | $107,700 |
| 2015 | $1,981 | $200,100 | $100,100 | $100,000 |
| 2014 | $1,810 | $192,500 | $107,600 | $84,900 |
Source: Public Records
Map
Nearby Homes
- 4906 Gulfstream Cir
- 4912 Brandywine Dr
- 4769 Marlborough Dr
- 809 Meighan Dr
- 4856 Admiration Dr
- 980 Larkaway Ct
- 5011 Ashforth Ct
- 5021 Eaton Ct
- 5009 Meadow Pines Place
- 4846 Kempsville Greens Pkwy Unit 404
- 5048 Clairmont Ct
- 5015 Dunderdale Ct
- 724 Oleander Cir
- 5044 Princess Anne Rd
- 668 Lord Dunmore Dr
- 4806 Gatwick Dr
- 5202 Jasmine Ct
- 5113 Stratford Chase Dr
- 5152 Violet Bank Dr
- 667 Oleander Cir
- 4936 Locke Ln
- 4940 Locke Ln
- 4932 Locke Ln
- 4929 Pimlico Cir
- 4925 Pimlico Cir
- 4933 Pimlico Cir
- 4928 Locke Ln
- 4933 Locke Ln
- 800 Churchill Dr
- 4921 Pimlico Cir
- 4929 Locke Ln
- 4924 Locke Ln
- 753 Churchill Dr
- 804 Churchill Dr
- 4917 Pimlico Cir
- 749 Churchill Dr
- 4912 Tropical Ct
- 4925 Locke Ln
- 4928 Pimlico Cir
- 745 Churchill Dr