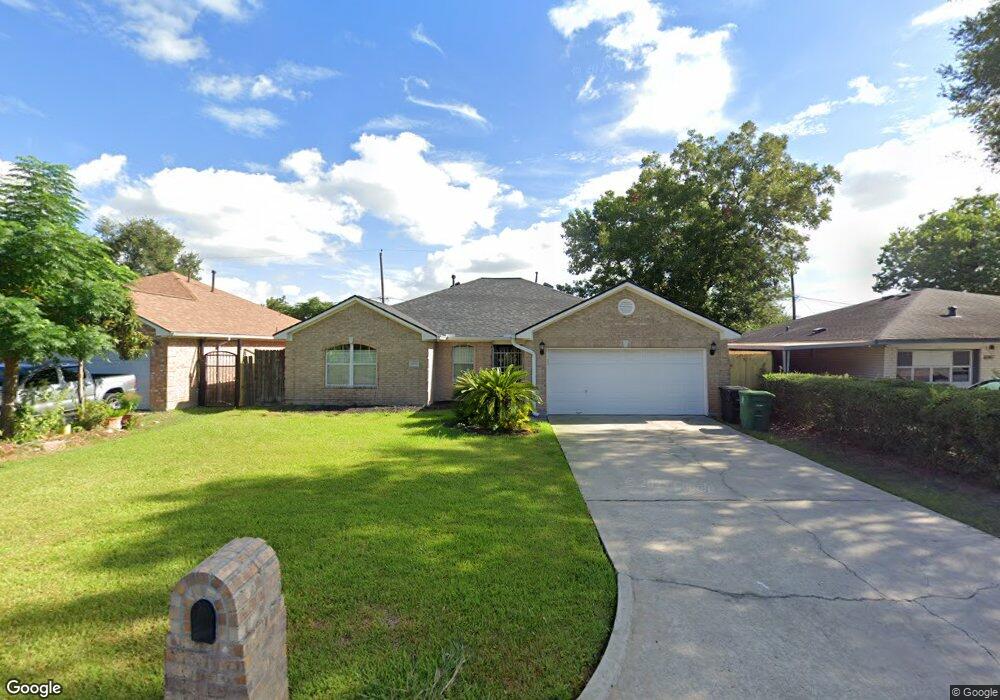
4937 Redbud St Houston, TX 77033
Sunnyside NeighborhoodEstimated Value: $240,000 - $288,000
3
Beds
2
Baths
1,748
Sq Ft
$153/Sq Ft
Est. Value
About This Home
This home is located at 4937 Redbud St, Houston, TX 77033 and is currently estimated at $267,947, approximately $153 per square foot. 4937 Redbud St is a home located in Harris County with nearby schools including Bastian Elementary School, Attucks Middle School, and Worthing High School.
Ownership History
Date
Name
Owned For
Owner Type
Purchase Details
Closed on
May 15, 2013
Sold by
Soko Investments
Bought by
Shepherd Cybil
Current Estimated Value
Purchase Details
Closed on
Oct 21, 2005
Sold by
Soko Investments
Bought by
Shepherd Cybil
Home Financials for this Owner
Home Financials are based on the most recent Mortgage that was taken out on this home.
Original Mortgage
$127,775
Interest Rate
5.73%
Mortgage Type
Construction
Create a Home Valuation Report for This Property
The Home Valuation Report is an in-depth analysis detailing your home's value as well as a comparison with similar homes in the area
Home Values in the Area
Average Home Value in this Area
Purchase History
| Date | Buyer | Sale Price | Title Company |
|---|---|---|---|
| Shepherd Cybil | -- | None Available | |
| Shepherd Cybil | -- | First American Title |
Source: Public Records
Mortgage History
| Date | Status | Borrower | Loan Amount |
|---|---|---|---|
| Previous Owner | Shepherd Cybil | $127,775 | |
| Closed | Shepherd Cybil | $0 |
Source: Public Records
Tax History Compared to Growth
Tax History
| Year | Tax Paid | Tax Assessment Tax Assessment Total Assessment is a certain percentage of the fair market value that is determined by local assessors to be the total taxable value of land and additions on the property. | Land | Improvement |
|---|---|---|---|---|
| 2025 | $2,299 | $316,444 | $70,144 | $246,300 |
| 2024 | $2,299 | $280,270 | $70,144 | $210,126 |
| 2023 | $2,299 | $251,090 | $56,115 | $194,975 |
| 2022 | $3,438 | $251,090 | $56,115 | $194,975 |
| 2021 | $3,308 | $191,627 | $37,410 | $154,217 |
| 2020 | $3,125 | $174,608 | $32,734 | $141,874 |
| 2019 | $2,968 | $117,298 | $14,029 | $103,269 |
| 2018 | $2,085 | $117,298 | $14,029 | $103,269 |
| 2017 | $2,966 | $117,298 | $14,029 | $103,269 |
| 2016 | $2,966 | $117,298 | $14,029 | $103,269 |
| 2015 | $2,049 | $107,826 | $14,029 | $93,797 |
| 2014 | $2,049 | $107,826 | $14,029 | $93,797 |
Source: Public Records
Map
Nearby Homes
- 4930 Teton St
- 4843 Bricker St
- 4830 Teton St
- 5115 Briscoe St Unit A/B
- 5007 Edfield St
- 4911 Edfield St
- 5019 Edfield St
- 7810 Darnay Dr
- 8107 Calhoun Rd
- 4903 Mayflower St
- 8201 Calhoun Rd Unit A/B
- 4741 Bricker St
- 0000 Darnay Dr
- 4718 Teton St
- 5102 Lyndhurst Dr
- 5103 Northridge Dr
- 5027 Willow Glen Dr Unit A-B
- 4614 Redbud St
- 5123 Northridge Dr
- 4607 Bricker St