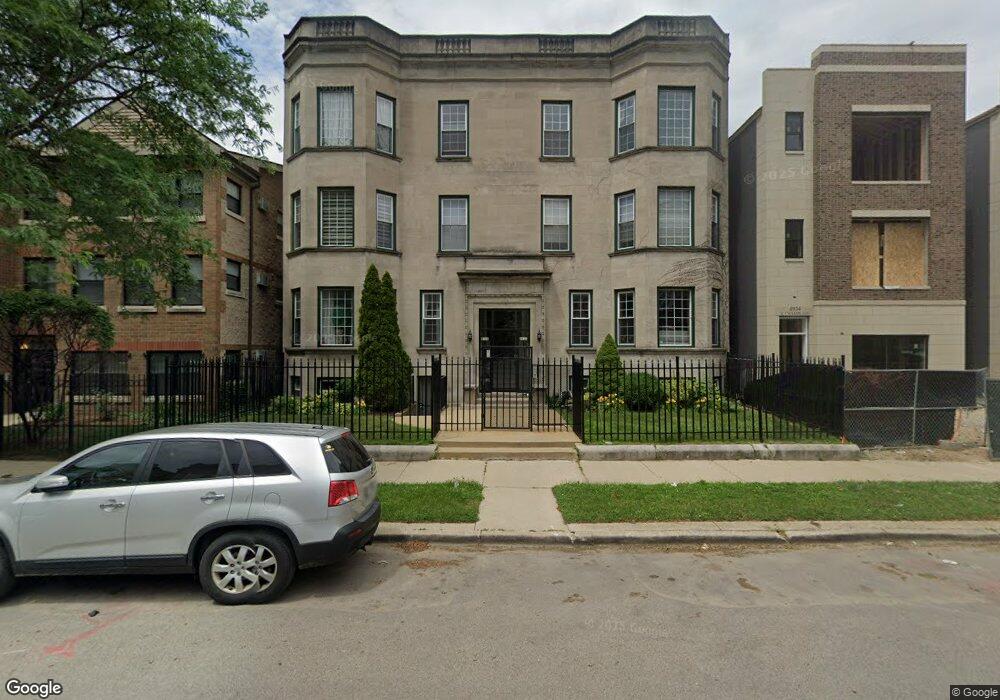
4938 S Champlain Ave Unit 1S Chicago, IL 60615
Grand Boulevard NeighborhoodEstimated Value: $336,000 - $450,000
3
Beds
3
Baths
2,700
Sq Ft
$150/Sq Ft
Est. Value
About This Home
This home is located at 4938 S Champlain Ave Unit 1S, Chicago, IL 60615 and is currently estimated at $405,078, approximately $150 per square foot. 4938 S Champlain Ave Unit 1S is a home located in Cook County with nearby schools including Reavis Elementary Math & Science Specialty School, Bronzeville Academy Charter School, and The Chicago Free School.
Ownership History
Date
Name
Owned For
Owner Type
Purchase Details
Closed on
Mar 18, 2019
Sold by
Golden City Investments
Bought by
Graham Reesheda
Current Estimated Value
Home Financials for this Owner
Home Financials are based on the most recent Mortgage that was taken out on this home.
Original Mortgage
$240,560
Outstanding Balance
$210,068
Interest Rate
4.37%
Mortgage Type
New Conventional
Estimated Equity
$195,010
Purchase Details
Closed on
Aug 10, 2018
Sold by
Mcelroy Summer A
Bought by
Golden City Investments Inc
Purchase Details
Closed on
Jul 21, 2011
Sold by
M & T Bank
Bought by
Mcelroy Summer A
Home Financials for this Owner
Home Financials are based on the most recent Mortgage that was taken out on this home.
Original Mortgage
$107,113
Interest Rate
4.25%
Mortgage Type
FHA
Purchase Details
Closed on
Mar 18, 2011
Sold by
Dixon
Bought by
M & T Bank
Create a Home Valuation Report for This Property
The Home Valuation Report is an in-depth analysis detailing your home's value as well as a comparison with similar homes in the area
Home Values in the Area
Average Home Value in this Area
Purchase History
| Date | Buyer | Sale Price | Title Company |
|---|---|---|---|
| Graham Reesheda | $248,000 | Attorney | |
| Golden City Investments Inc | $111,000 | None Available | |
| Mcelroy Summer A | $110,000 | First American | |
| M & T Bank | -- | None Available |
Source: Public Records
Mortgage History
| Date | Status | Borrower | Loan Amount |
|---|---|---|---|
| Open | Graham Reesheda | $240,560 | |
| Previous Owner | Mcelroy Summer A | $107,113 |
Source: Public Records
Tax History
| Year | Tax Paid | Tax Assessment Tax Assessment Total Assessment is a certain percentage of the fair market value that is determined by local assessors to be the total taxable value of land and additions on the property. | Land | Improvement |
|---|---|---|---|---|
| 2025 | $5,471 | $33,208 | $5,244 | $27,964 |
| 2024 | $5,471 | $33,208 | $5,244 | $27,964 |
| 2023 | $5,333 | $25,849 | $5,244 | $20,605 |
| 2022 | $5,333 | $25,849 | $5,244 | $20,605 |
| 2021 | $5,213 | $25,847 | $5,243 | $20,604 |
| 2020 | $3,166 | $14,213 | $2,546 | $11,667 |
| 2019 | $3,149 | $15,673 | $2,546 | $13,127 |
| 2018 | $3,191 | $19,592 | $2,546 | $17,046 |
| 2017 | $3,568 | $19,948 | $2,097 | $17,851 |
| 2016 | $3,495 | $19,948 | $2,097 | $17,851 |
| 2015 | $3,175 | $19,948 | $2,097 | $17,851 |
| 2014 | $3,257 | $20,125 | $1,797 | $18,328 |
| 2013 | $3,182 | $20,125 | $1,797 | $18,328 |
Source: Public Records
Map
Nearby Homes
- 4931 S Champlain Ave
- 4934 S Champlain Ave
- 4932 S Champlain Ave
- 5004 S Champlain Ave Unit 1
- 6318 S Langley Ave
- 618 E 50th Place
- 559 E 50th St
- 611 E 50th Place
- 4925 S Forrestville Ave Unit 3S
- 4829 S Champlain Ave
- 4827 S Saint Lawrence Ave
- 6316 S Evans Ave
- 4837 S Forrestville Ave Unit 1
- 4755 S St Lawrence Ave Unit B3
- 4754 S Langley Ave
- 4759 S Forrestville Ave Unit 1W
- 835 E 49th St Unit 3
- 4730 S Champlain Ave Unit 3
- 4732 S Evans Ave
- 4914 S Washington Park Ct
- 4938 S Champlain Ave Unit 1S
- 4938 S Champlain Ave Unit 3S
- 4938 S Champlain Ave Unit 2S
- 4936 S Champlain Ave Unit 2N
- 4936 S Champlain Ave Unit 1N
- 4936 S Champlain Ave Unit 3N
- 4952 S Champlain Ave
- 4940 S Champlain Ave
- 4926 S Champlain Ave
- 4922 S Champlain Ave
- 4850 S Cottage Grove Ave
- 4937 S Saint Lawrence Ave Unit 2R
- 4950 S Champlain Ave
- 4941 S Saint Lawrence Ave Unit 1
- 4941 S Saint Lawrence Ave
- 4939 S Saint Lawrence Ave
- 4939 S Saint Lawrence Ave
- 4943 S Saint Lawrence Ave
- 4943 S Saint Lawrence Ave Unit 2
- 4943 S Saint Lawrence Ave Unit 1
Your Personal Tour Guide
Ask me questions while you tour the home.