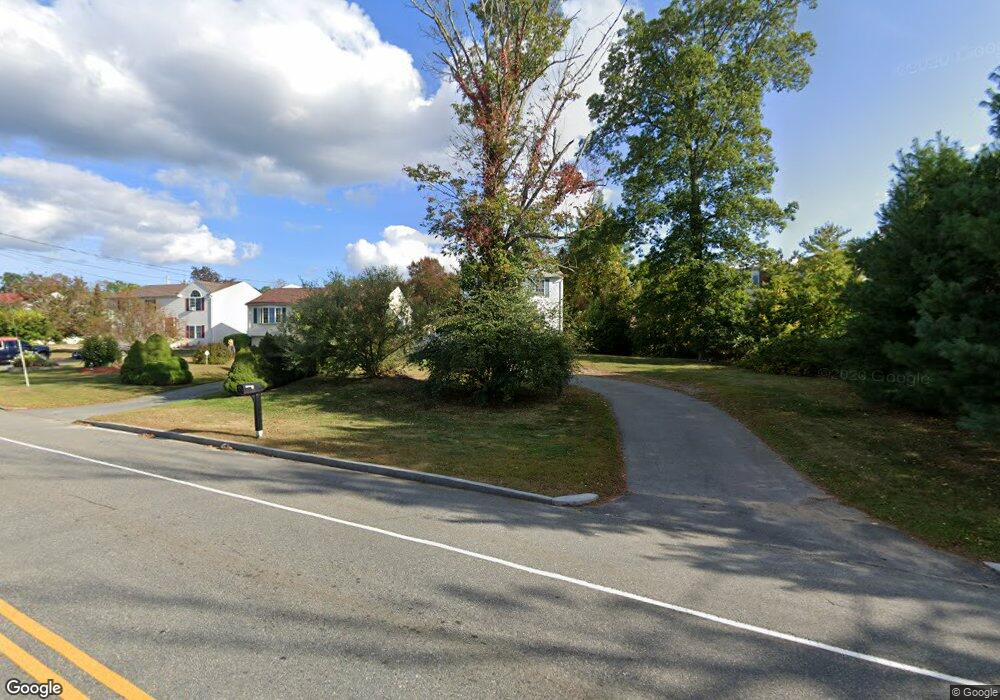
4939 N Main St Fall River, MA 02720
Western Fall River NeighborhoodEstimated Value: $445,782 - $565,000
3
Beds
2
Baths
1,624
Sq Ft
$324/Sq Ft
Est. Value
About This Home
This home is located at 4939 N Main St, Fall River, MA 02720 and is currently estimated at $526,696, approximately $324 per square foot. 4939 N Main St is a home located in Bristol County with nearby schools including North End Elementary School, Morton Middle School, and B M C Durfee High School.
Ownership History
Date
Name
Owned For
Owner Type
Purchase Details
Closed on
May 19, 2000
Sold by
Vintage Homes Inc
Bought by
Souza Kimberly A and Souza Joanne
Current Estimated Value
Home Financials for this Owner
Home Financials are based on the most recent Mortgage that was taken out on this home.
Original Mortgage
$117,000
Interest Rate
8.19%
Mortgage Type
Purchase Money Mortgage
Create a Home Valuation Report for This Property
The Home Valuation Report is an in-depth analysis detailing your home's value as well as a comparison with similar homes in the area
Home Values in the Area
Average Home Value in this Area
Purchase History
| Date | Buyer | Sale Price | Title Company |
|---|---|---|---|
| Souza Kimberly A | $129,900 | -- |
Source: Public Records
Mortgage History
| Date | Status | Borrower | Loan Amount |
|---|---|---|---|
| Open | Souza Kimberly A | $150,000 | |
| Closed | Souza Kimberly A | $117,000 | |
| Closed | Souza Kimberly A | $117,000 |
Source: Public Records
Tax History
| Year | Tax Paid | Tax Assessment Tax Assessment Total Assessment is a certain percentage of the fair market value that is determined by local assessors to be the total taxable value of land and additions on the property. | Land | Improvement |
|---|---|---|---|---|
| 2025 | $4,054 | $354,100 | $117,300 | $236,800 |
| 2024 | $3,817 | $332,200 | $115,000 | $217,200 |
| 2023 | $3,950 | $321,900 | $103,600 | $218,300 |
| 2022 | $3,507 | $277,900 | $97,700 | $180,200 |
| 2021 | $3,428 | $247,900 | $93,400 | $154,500 |
| 2020 | $3,373 | $233,400 | $89,100 | $144,300 |
| 2019 | $3,374 | $231,400 | $93,100 | $138,300 |
| 2018 | $3,531 | $241,500 | $111,500 | $130,000 |
| 2017 | $3,219 | $229,900 | $102,300 | $127,600 |
| 2016 | $3,023 | $221,800 | $102,300 | $119,500 |
| 2015 | $2,940 | $224,800 | $102,300 | $122,500 |
| 2014 | $2,741 | $217,900 | $95,400 | $122,500 |
Source: Public Records
Map
Nearby Homes
- 5065 N Main St Unit 2
- 22 Apple Creek Ln
- 5455 N Main St Unit 10B
- 5455 N Main St Unit 2C
- 4234 N Main St Unit 103
- 3896 N Main St
- 3753 N Main St Unit 1
- 3682 N Main St Unit 6
- 0 Palmer St
- 3636 N Main St Unit 5
- 2714 Riverside Ave
- 72 Ida Ln
- 145 Mount Hope Rd
- 30 Gray St
- 2396 Riverside Ave
- 485 Whetstone Hill Rd
- 560 North St
- 4 Narrows Rd
- 111 Almy Rd
- Parcel 2 Highcrest Rd
- 4955 N Main St
- 4989 N Main St
- 12 Cheryls Way
- 24 Cheryls Way
- 195 Point West Dr
- 5013 N Main St Unit 1
- 5013 N Main St
- 36 Cheryls Way
- 177 Point West Dr
- 44 Cheryls Way
- 5029 N Main St
- 25 Cheryls Way
- 200 Point West Dr
- 272 Horizon Way
- 155 Point West Dr
- 50 Cheryls Way
- 39 Cheryls Way
- 5045 N Main St Unit 3
- 5045 N Main St Unit 2
- 5045 N Main St Unit 1
Your Personal Tour Guide
Ask me questions while you tour the home.