Estimated Value: $142,000 - $159,000
3
Beds
1
Bath
1,144
Sq Ft
$130/Sq Ft
Est. Value
About This Home
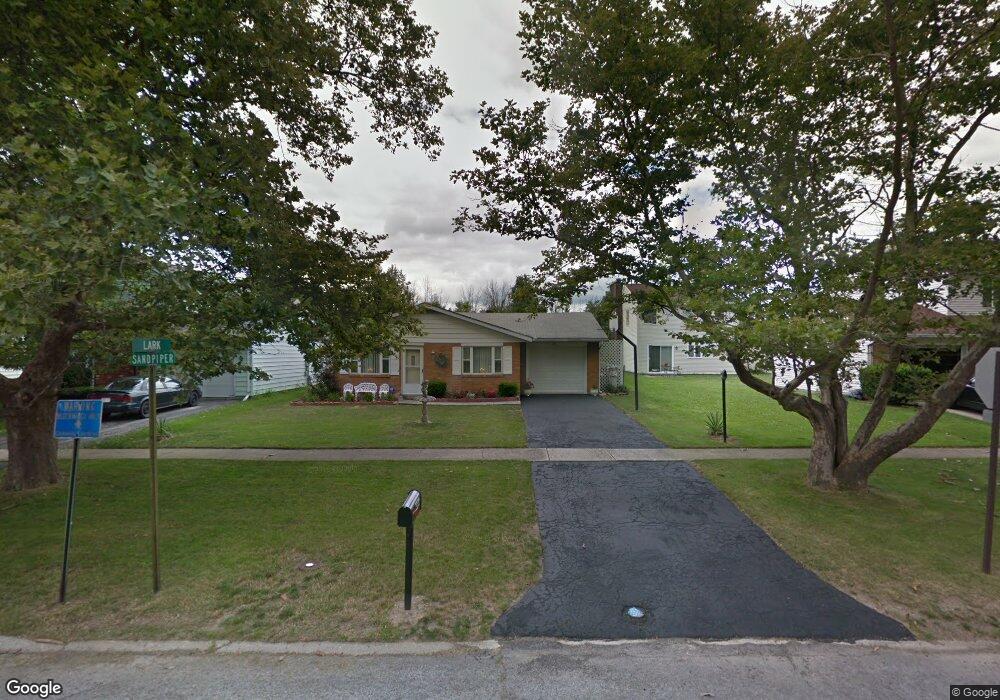
This home is located at 494 Sandpiper St, Lima, OH 45801 and is currently estimated at $148,640, approximately $129 per square foot. 494 Sandpiper St is a home located in Allen County with nearby schools including Elida Elementary School, Elida Middle School, and Elida High School.
Ownership History
Date
Name
Owned For
Owner Type
Purchase Details
Closed on
Dec 19, 2007
Sold by
Johnson Renella
Bought by
Johnson Wendy F
Current Estimated Value
Home Financials for this Owner
Home Financials are based on the most recent Mortgage that was taken out on this home.
Original Mortgage
$60,000
Outstanding Balance
$39,329
Interest Rate
7%
Mortgage Type
Purchase Money Mortgage
Estimated Equity
$109,311
Purchase Details
Closed on
Jul 19, 2006
Sold by
Johnson Renella
Bought by
Johnson Wendy F
Purchase Details
Closed on
Aug 19, 1994
Sold by
Danser Paul
Bought by
Johnson Renella
Home Financials for this Owner
Home Financials are based on the most recent Mortgage that was taken out on this home.
Original Mortgage
$25,500
Interest Rate
8.73%
Mortgage Type
New Conventional
Purchase Details
Closed on
Nov 1, 1981
Bought by
Danser Paul S
Create a Home Valuation Report for This Property
The Home Valuation Report is an in-depth analysis detailing your home's value as well as a comparison with similar homes in the area
Purchase History
| Date | Buyer | Sale Price | Title Company |
|---|---|---|---|
| Johnson Wendy F | -- | Star Title Agency Llc | |
| Johnson Wendy F | -- | None Available | |
| Johnson Renella | $51,000 | -- | |
| Danser Paul S | $37,000 | -- |
Source: Public Records
Mortgage History
| Date | Status | Borrower | Loan Amount |
|---|---|---|---|
| Open | Johnson Wendy F | $60,000 | |
| Previous Owner | Johnson Renella | $25,500 |
Source: Public Records
Tax History
| Year | Tax Paid | Tax Assessment Tax Assessment Total Assessment is a certain percentage of the fair market value that is determined by local assessors to be the total taxable value of land and additions on the property. | Land | Improvement |
|---|---|---|---|---|
| 2024 | $2,417 | $39,100 | $5,150 | $33,950 |
| 2023 | $1,934 | $27,940 | $3,680 | $24,260 |
| 2022 | $2,038 | $27,940 | $3,680 | $24,260 |
| 2021 | $2,151 | $27,940 | $3,680 | $24,260 |
| 2020 | $2,047 | $24,020 | $3,540 | $20,480 |
| 2019 | $2,047 | $24,020 | $3,540 | $20,480 |
| 2018 | $1,728 | $24,020 | $3,540 | $20,480 |
| 2017 | $1,533 | $19,120 | $3,540 | $15,580 |
| 2016 | $1,618 | $19,120 | $3,540 | $15,580 |
| 2015 | $1,630 | $19,120 | $3,540 | $15,580 |
| 2014 | $1,630 | $19,460 | $3,430 | $16,030 |
| 2013 | $1,368 | $19,460 | $3,430 | $16,030 |
Source: Public Records
Map
Nearby Homes
- 475 Kenmore St
- 520 Kenmore St
- 2224 N Metcalf St
- 1705 Karen St
- 2126 N Metcalf St
- 500 W Northern Ave
- 2380 Mandolin Dr
- 1014 Brower Rd
- 2371 Mandolin Dr
- 1143 Brower Rd
- 207 W Lane Ave
- 660 W Lane Ave
- 1889 N Metcalf St
- 1212 Virginia Ave
- 3137 Thorndyke Dr
- 1435 N Central Ave
- 0 Thorndyke Dr
- 535 W Bluelick Rd
- 608 W O'Connor Ave
- 2718 Carolyn Dr
- 500 Sandpiper St
- 476 Sandpiper St
- 117 Lady Bird Ln
- 516 Sandpiper St
- 137 Lady Bird Ln
- 128 Lyre Bird Ln
- 2480 Lark Ave
- 2479 Lark Ave
- 138 Lyre Bird Ln
- 467 Sandpiper St
- 147 Lady Bird Ln
- 116 Lady Bird Ln
- 108 Lyre Bird Ln
- 118 Lyre Bird Ln
- 523 Sandpiper St
- 157 Lady Bird Ln
- 166 Lady Bird Ln
- 459 Sandpiper St
- 156 Lady Bird Ln
Your Personal Tour Guide
Ask me questions while you tour the home.