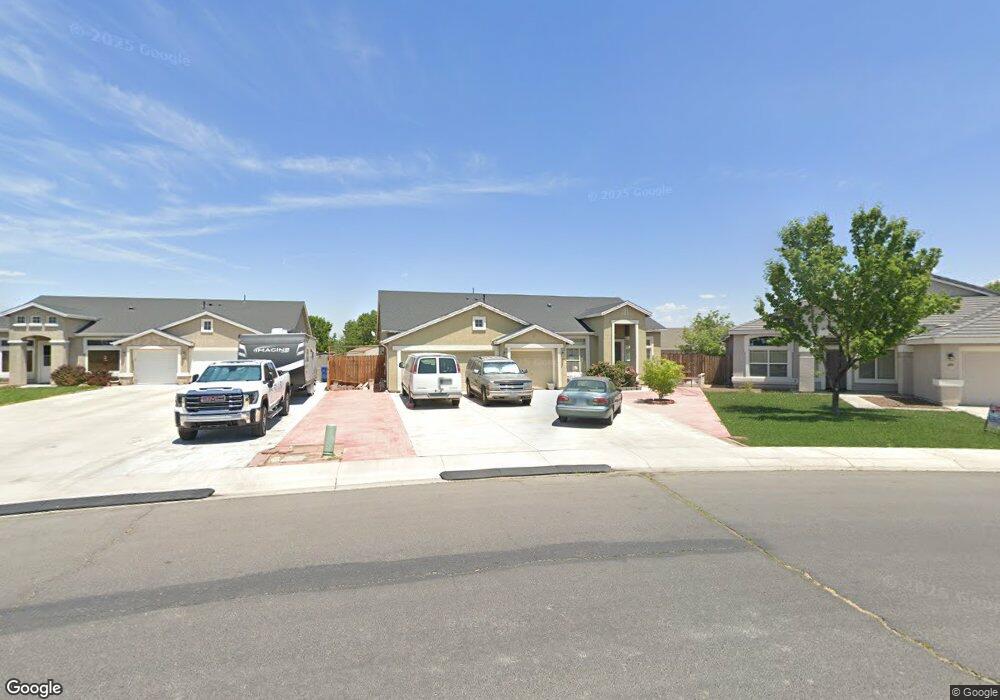
494 Sapphire Way Fallon, NV 89406
Estimated Value: $463,000 - $478,000
4
Beds
2
Baths
2,262
Sq Ft
$209/Sq Ft
Est. Value
About This Home
This home is located at 494 Sapphire Way, Fallon, NV 89406 and is currently estimated at $472,624, approximately $208 per square foot. 494 Sapphire Way is a home located in Churchill County with nearby schools including E.C. Best Elementary School, Numa Elementary School, and Lahontan Elementary School.
Ownership History
Date
Name
Owned For
Owner Type
Purchase Details
Closed on
Sep 23, 2008
Sold by
Wells Fargo Bank Na
Bought by
Lee Raymond and Lee Elsa
Current Estimated Value
Purchase Details
Closed on
Feb 6, 2008
Sold by
Delgado Maria Delourdes
Bought by
Wells Fargo Bank Na and Abfc 2006-Opt2 Trust Abfc Asset Backed C
Purchase Details
Closed on
Aug 14, 2006
Sold by
Diamond Creek Project Llc
Bought by
Delgado Maria Delourdes
Home Financials for this Owner
Home Financials are based on the most recent Mortgage that was taken out on this home.
Original Mortgage
$305,368
Interest Rate
8.4%
Mortgage Type
Purchase Money Mortgage
Purchase Details
Closed on
Aug 11, 2006
Sold by
Garcia Edgar Villanueva
Bought by
Delgado Maria Delourdes
Home Financials for this Owner
Home Financials are based on the most recent Mortgage that was taken out on this home.
Original Mortgage
$305,368
Interest Rate
8.4%
Mortgage Type
Purchase Money Mortgage
Create a Home Valuation Report for This Property
The Home Valuation Report is an in-depth analysis detailing your home's value as well as a comparison with similar homes in the area
Home Values in the Area
Average Home Value in this Area
Purchase History
| Date | Buyer | Sale Price | Title Company |
|---|---|---|---|
| Lee Raymond | $202,650 | Western Nevada Title Company | |
| Wells Fargo Bank Na | $233,750 | None Available | |
| Delgado Maria Delourdes | $305,368 | Western Title Company Inc | |
| Delgado Maria Delourdes | -- | Western Title Company Inc |
Source: Public Records
Mortgage History
| Date | Status | Borrower | Loan Amount |
|---|---|---|---|
| Previous Owner | Delgado Maria Delourdes | $305,368 |
Source: Public Records
Tax History
| Year | Tax Paid | Tax Assessment Tax Assessment Total Assessment is a certain percentage of the fair market value that is determined by local assessors to be the total taxable value of land and additions on the property. | Land | Improvement |
|---|---|---|---|---|
| 2025 | $3,892 | $133,475 | $21,700 | $111,775 |
| 2024 | $3,892 | $132,722 | $19,950 | $112,772 |
| 2023 | $3,892 | $124,645 | $19,950 | $104,695 |
| 2022 | $3,495 | $103,902 | $13,300 | $90,602 |
| 2021 | $3,391 | $101,327 | $13,300 | $88,027 |
| 2020 | $3,288 | $102,957 | $13,300 | $89,657 |
| 2019 | $3,192 | $100,522 | $13,300 | $87,222 |
| 2018 | $3,099 | $96,903 | $12,250 | $84,653 |
| 2017 | $3,009 | $97,012 | $12,250 | $84,762 |
| 2016 | $2,538 | $77,417 | $9,800 | $67,617 |
| 2015 | $2,489 | $69,701 | $9,800 | $59,901 |
| 2014 | $2,430 | $64,245 | $9,800 | $54,445 |
Source: Public Records
Map
Nearby Homes
- 374 Calaway Ct
- 604 Serpa Place
- 00 Serpa Place
- 604 Keppel St
- 618 Keppel St
- 621 Keppel St
- 710 Keppel St
- 728 Keppel St
- 800 Great Basin Ln
- 882 Great Basin Ln
- 119 Toiyabe Ln
- 1383 Rambling Wind Dr
- 009-291-74 00929174
- 285 Amanda Ln
- 815 Great Basin Ln
- 280 Hunter Park Way
- 830 E Stillwater Ave Unit 15
- 750 E Stillwater Ave Unit 51
- 750 E Stillwater Ave Unit 12
- 750 E Stillwater Ave Unit 164
- 494 Sapphire Dr
- 480 Sapphire Dr
- 689 Coral Dr
- 667 Coral Dr
- 462 Sapphire Dr
- 462 Sapphire Way
- 477 Sapphire Way
- 643 Coral Dr
- 459 Sapphire Way
- 446 Sapphire Way
- 472 Agate Ln
- 472 Agate Ln Unit Lot 18
- 441 Sapphire Dr
- 441 Sapphire Way
- 627 Coral Dr
- 428 Sapphire Way
- 428 Sapphire Dr
- 454 Agate Ln
- 423 Sapphire Way
- 436 Agate Ln
Your Personal Tour Guide
Ask me questions while you tour the home.