494 Swain Ave Sebastopol, CA 95472
Estimated Value: $1,145,000 - $1,405,000
3
Beds
3
Baths
2,568
Sq Ft
$489/Sq Ft
Est. Value
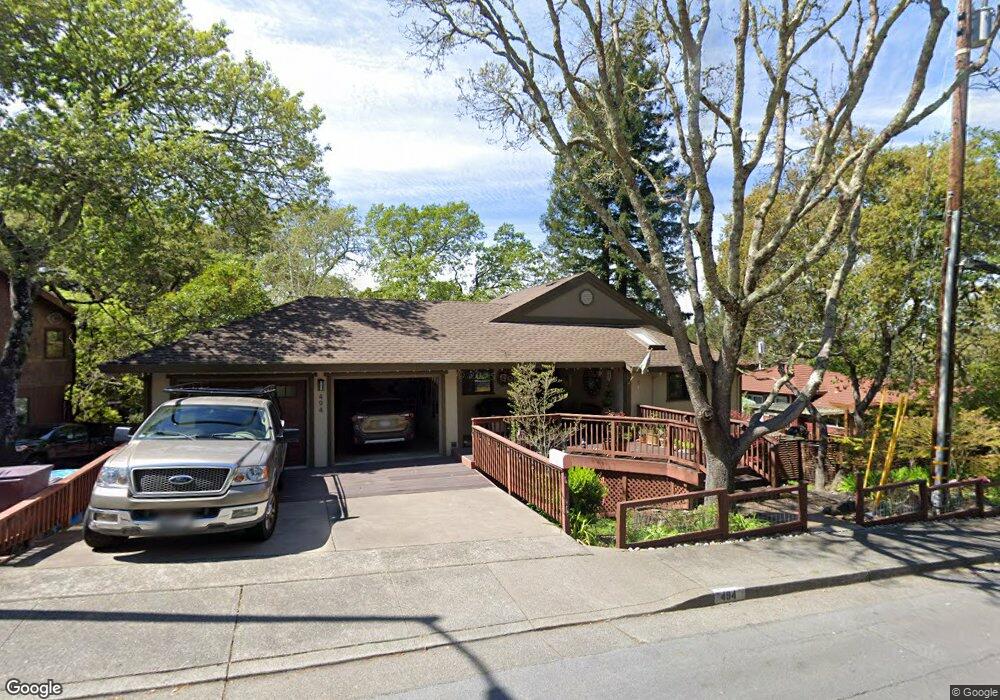
About This Home
This home is located at 494 Swain Ave, Sebastopol, CA 95472 and is currently estimated at $1,256,692, approximately $489 per square foot. 494 Swain Ave is a home located in Sonoma County with nearby schools including Park Side Elementary School, Brook Haven Elementary School, and Analy High School.
Ownership History
Date
Name
Owned For
Owner Type
Purchase Details
Closed on
Aug 28, 1997
Sold by
Swedenborg Dan A and Swedenborg Kelly R
Bought by
Swedenborg Dan A and Swedenborg Kelly R
Current Estimated Value
Home Financials for this Owner
Home Financials are based on the most recent Mortgage that was taken out on this home.
Original Mortgage
$228,750
Outstanding Balance
$34,498
Interest Rate
7.61%
Estimated Equity
$1,222,194
Purchase Details
Closed on
Aug 7, 1997
Sold by
Madsen David R and Madsen Carleen M
Bought by
Swedenborg Dan A and Swedenborg Kelly R
Home Financials for this Owner
Home Financials are based on the most recent Mortgage that was taken out on this home.
Original Mortgage
$228,750
Outstanding Balance
$34,498
Interest Rate
7.61%
Estimated Equity
$1,222,194
Purchase Details
Closed on
Jan 19, 1995
Sold by
Madsen David R and Madsen Carleen M
Bought by
Herman Stephen and Herman Michele
Create a Home Valuation Report for This Property
The Home Valuation Report is an in-depth analysis detailing your home's value as well as a comparison with similar homes in the area
Home Values in the Area
Average Home Value in this Area
Purchase History
| Date | Buyer | Sale Price | Title Company |
|---|---|---|---|
| Swedenborg Dan A | -- | First American Title | |
| Swedenborg Dan A | $305,000 | First American Title | |
| Herman Stephen | -- | North Bay Title Co |
Source: Public Records
Mortgage History
| Date | Status | Borrower | Loan Amount |
|---|---|---|---|
| Open | Swedenborg Dan A | $228,750 | |
| Closed | Swedenborg Dan A | $228,750 |
Source: Public Records
Tax History Compared to Growth
Tax History
| Year | Tax Paid | Tax Assessment Tax Assessment Total Assessment is a certain percentage of the fair market value that is determined by local assessors to be the total taxable value of land and additions on the property. | Land | Improvement |
|---|---|---|---|---|
| 2025 | $5,630 | $486,990 | $199,585 | $287,405 |
| 2024 | $5,630 | $477,442 | $195,672 | $281,770 |
| 2023 | $5,630 | $468,082 | $191,836 | $276,246 |
| 2022 | $5,442 | $458,905 | $188,075 | $270,830 |
| 2021 | $5,415 | $449,908 | $184,388 | $265,520 |
| 2020 | $5,311 | $445,296 | $182,498 | $262,798 |
| 2019 | $5,177 | $436,566 | $178,920 | $257,646 |
| 2018 | $5,102 | $428,007 | $175,412 | $252,595 |
| 2017 | $4,878 | $419,616 | $171,973 | $247,643 |
| 2016 | $4,770 | $411,389 | $168,601 | $242,788 |
| 2015 | $4,621 | $405,211 | $166,069 | $239,142 |
| 2014 | $4,540 | $397,274 | $162,816 | $234,458 |
Source: Public Records
Map
Nearby Homes
- 7600 Bodega Ave
- 7720 Bodega Ave Unit 3
- 5200 California 116
- 1300 Hwy 116 N
- 830 Litchfield Ave
- 105 Virginia Ave Unit 3
- 5301 Gravenstein Hwy S
- 7826 Brookside Ave
- 7580 Meadowlark Dr
- 6917 Redwood Ave
- 8023 Washington Ave
- 7739 Lynch Rd
- 8148 Bodega Ave
- 6781 Evergreen Ave
- 512 Norlee St
- 1171 Gravenstein Hwy S
- 0 Bodega Hwy
- 1466 Cooper Rd
- 8061 Elphick Rd
- 1220 Gravenstein Hwy N