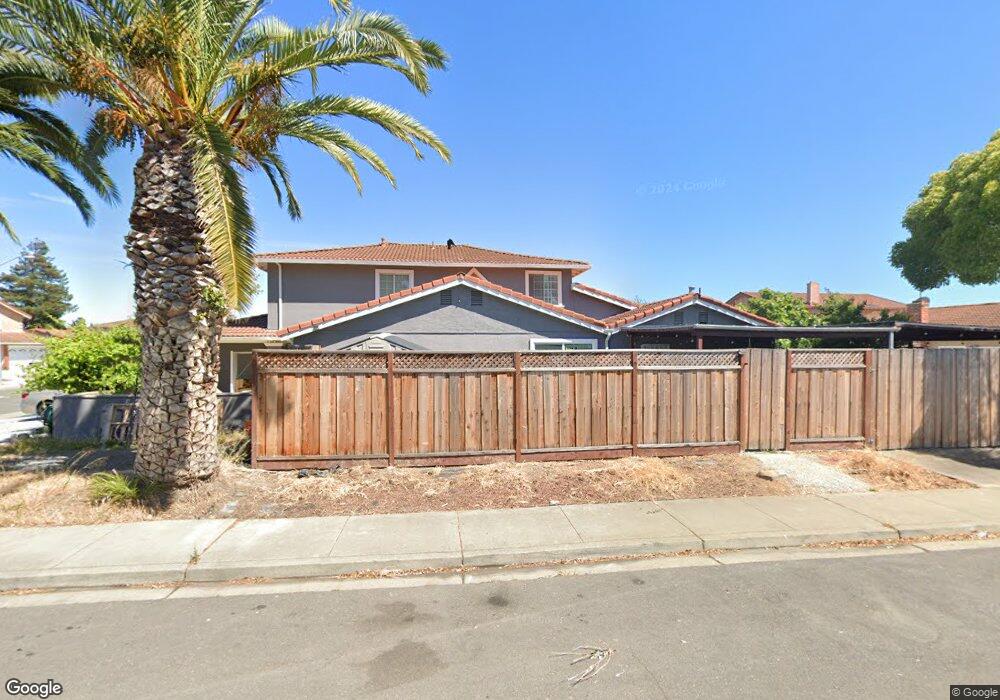
4940 Antioch Loop Union City, CA 94587
Alvarado NeighborhoodEstimated Value: $1,599,000 - $1,976,000
6
Beds
4
Baths
2,573
Sq Ft
$684/Sq Ft
Est. Value
About This Home
This home is located at 4940 Antioch Loop, Union City, CA 94587 and is currently estimated at $1,761,187, approximately $684 per square foot. 4940 Antioch Loop is a home located in Alameda County with nearby schools including Pioneer Elementary School, Itliong-Vera Cruz, and James Logan High School.
Ownership History
Date
Name
Owned For
Owner Type
Purchase Details
Closed on
Jul 29, 2014
Sold by
Qadir Abdul and Gul Wasif S
Bought by
Qadir Abdul and Khan Rameez Q
Current Estimated Value
Home Financials for this Owner
Home Financials are based on the most recent Mortgage that was taken out on this home.
Original Mortgage
$462,000
Interest Rate
4.09%
Mortgage Type
New Conventional
Purchase Details
Closed on
Jun 25, 2010
Sold by
Khan Sofia Bibi
Bought by
Qadir Abdul
Purchase Details
Closed on
Apr 15, 2010
Sold by
Jpmorgan Chase Bank National Association
Bought by
Qadir Abdul and Gul Wasif S
Home Financials for this Owner
Home Financials are based on the most recent Mortgage that was taken out on this home.
Original Mortgage
$542,947
Interest Rate
4.79%
Mortgage Type
FHA
Purchase Details
Closed on
Dec 3, 2009
Sold by
Khn Hakim and Khan Waqar A
Bought by
Jpmorgan Chase Bank National Association
Purchase Details
Closed on
May 27, 2008
Sold by
Khan Nayyar and Khan Waqar
Bought by
Capital Alliance Income Trust
Purchase Details
Closed on
Mar 4, 2008
Sold by
Khan Nayyar and Khan Waqar
Bought by
Del Rose Holding Co and Hilltop Asset Protection
Purchase Details
Closed on
Mar 15, 2006
Sold by
Khan Hakim and Khan Waqar
Bought by
Khan Waqar and Khan Nayyar
Home Financials for this Owner
Home Financials are based on the most recent Mortgage that was taken out on this home.
Original Mortgage
$725,000
Interest Rate
6.18%
Mortgage Type
Stand Alone Second
Purchase Details
Closed on
Apr 28, 2003
Sold by
Khan Hakim
Bought by
Khan Hakim and Khan Waqar A
Home Financials for this Owner
Home Financials are based on the most recent Mortgage that was taken out on this home.
Original Mortgage
$468,800
Interest Rate
4.42%
Purchase Details
Closed on
Feb 18, 2003
Sold by
Khan Waqar A and Khan Sabra Hakim
Bought by
Khan Hakim
Purchase Details
Closed on
Dec 10, 1998
Sold by
Khan Nayyar S
Bought by
Khan Waqar A
Home Financials for this Owner
Home Financials are based on the most recent Mortgage that was taken out on this home.
Original Mortgage
$269,200
Interest Rate
6.86%
Purchase Details
Closed on
May 12, 1997
Sold by
Perreras Hilarion and Perreras Corazon
Bought by
Laguardia Dax and Laguardia Linda P
Purchase Details
Closed on
Apr 15, 1997
Sold by
Laguardia Linda P and Laguardia Allan V
Bought by
Perreras Corazon L and Perreras Hilarion L
Create a Home Valuation Report for This Property
The Home Valuation Report is an in-depth analysis detailing your home's value as well as a comparison with similar homes in the area
Home Values in the Area
Average Home Value in this Area
Purchase History
| Date | Buyer | Sale Price | Title Company |
|---|---|---|---|
| Qadir Abdul | $308,000 | Chicago Title Company | |
| Qadir Abdul | -- | Lsi Title Agency Inc | |
| Gul Wasif S | -- | Lsi Title Agency Inc | |
| Qadir Abdul | $590,000 | Lsi Title Agency Inc | |
| Jpmorgan Chase Bank National Association | $536,585 | None Available | |
| Capital Alliance Income Trust | $40,000 | Fatco | |
| Del Rose Holding Co | -- | None Available | |
| Khan Waqar | $362,500 | Alliance Title Company | |
| Khan Hakim | $234,500 | Placer Title Company | |
| Khan Waqar A | -- | Placer Title Company | |
| Khan Hakim | -- | -- | |
| Khan Waqar A | -- | Nortwestern Title Company | |
| Khan Waqar A | $336,500 | Nortwestern Title Company | |
| Laguardia Dax | -- | -- | |
| Perreras Corazon L | -- | -- |
Source: Public Records
Mortgage History
| Date | Status | Borrower | Loan Amount |
|---|---|---|---|
| Previous Owner | Qadir Abdul | $462,000 | |
| Previous Owner | Qadir Abdul | $542,947 | |
| Previous Owner | Khan Waqar | $725,000 | |
| Previous Owner | Khan Hakim | $468,800 | |
| Previous Owner | Khan Waqar A | $269,200 |
Source: Public Records
Tax History
| Year | Tax Paid | Tax Assessment Tax Assessment Total Assessment is a certain percentage of the fair market value that is determined by local assessors to be the total taxable value of land and additions on the property. | Land | Improvement |
|---|---|---|---|---|
| 2025 | $11,851 | $852,858 | $255,857 | $597,001 |
| 2024 | $11,851 | $836,140 | $250,842 | $585,298 |
| 2023 | $11,474 | $819,748 | $245,924 | $573,824 |
| 2022 | $11,324 | $803,675 | $241,102 | $562,573 |
| 2021 | $11,030 | $787,920 | $236,376 | $551,544 |
| 2020 | $11,003 | $779,844 | $233,953 | $545,891 |
| 2019 | $10,935 | $764,560 | $229,368 | $535,192 |
| 2018 | $10,675 | $749,572 | $224,871 | $524,701 |
| 2017 | $10,455 | $734,877 | $220,463 | $514,414 |
| 2016 | $10,225 | $720,471 | $216,141 | $504,330 |
| 2015 | $10,109 | $709,650 | $212,895 | $496,755 |
| 2014 | $8,639 | $616,620 | $184,986 | $431,634 |
Source: Public Records
Map
Nearby Homes
- 32518 Shiela Ct
- 4845 Tammy Ct
- 4701 Michelle Way
- 4648 Michelle Ct
- 4822 La Habra St
- 4600 Delores Dr
- 4819 Kenwood St
- 32409 Elizabeth Way
- 33038 Garfinkle St
- 4625 Ruth Way
- 32508 Regents Blvd
- 4469 Fellows St
- 32301 Ruth Ct
- 4940 Bunkhouse St
- 4513 Birchwood Ct
- 4311 Blondwood Ct
- 4541 Darcelle Dr
- 5358 Matthew Terrace
- 5410 Buckner Terrace
- 31500 Silvertide Dr
- 4938 Antioch Loop
- 4955 Antioch Loop
- 4957 Antioch Loop
- 4936 Antioch Loop
- 4947 Antioch Loop
- 4945 Antioch Loop
- 4939 Antioch Loop
- 4959 Antioch Loop
- 4937 Antioch Loop
- 4949 Antioch Loop
- 4934 Antioch Loop
- 4935 Antioch Loop
- 4941 Antioch Loop
- 4951 Antioch Loop
- 4961 Antioch Loop
- 4933 Antioch Loop
- 4932 Antioch Loop
- 4956 Antioch Loop
- 32704 Bel Aire St
- 4953 Antioch Loop
Your Personal Tour Guide
Ask me questions while you tour the home.