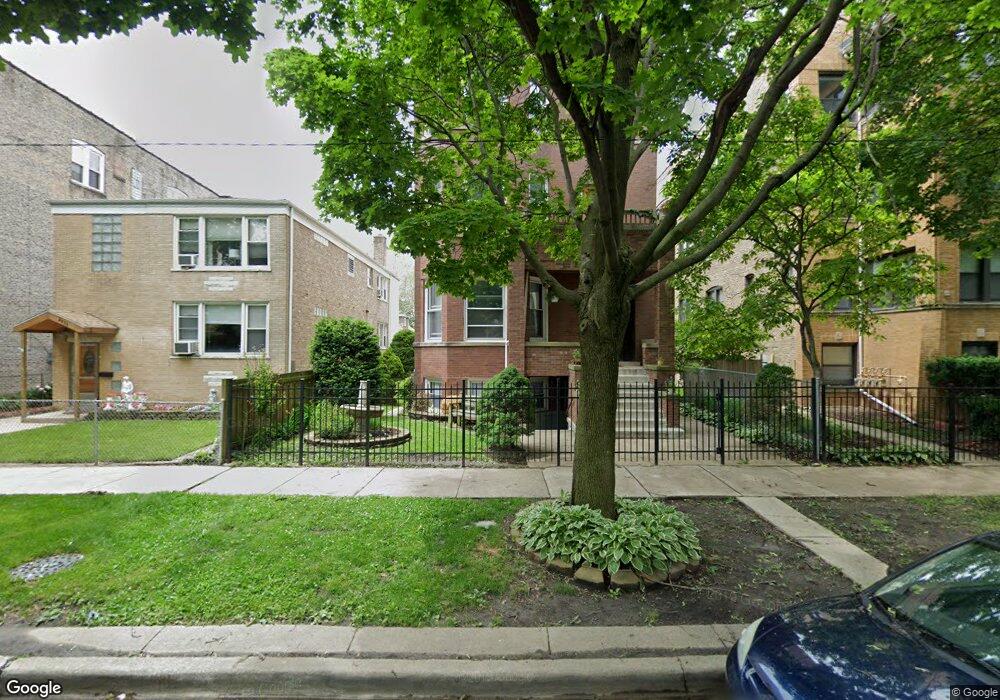
4940 N Ridgeway Ave Unit 1 Chicago, IL 60625
Albany Park NeighborhoodEstimated Value: $359,000 - $468,000
4
Beds
2
Baths
2,200
Sq Ft
$191/Sq Ft
Est. Value
About This Home
This home is located at 4940 N Ridgeway Ave Unit 1, Chicago, IL 60625 and is currently estimated at $419,623, approximately $190 per square foot. 4940 N Ridgeway Ave Unit 1 is a home located in Cook County with nearby schools including Volta Elementary School, Roosevelt High School, and ASPIRA Haugan Middle School.
Ownership History
Date
Name
Owned For
Owner Type
Purchase Details
Closed on
Mar 23, 2023
Sold by
Zwicker Brittany and Zwicker Brian
Bought by
Brittany Zwicker Revocable Living Trust
Current Estimated Value
Purchase Details
Closed on
Mar 11, 2017
Sold by
Crumpton Neil and Simek Julie
Bought by
Meyers Brian S and Zwicker Brittany L
Home Financials for this Owner
Home Financials are based on the most recent Mortgage that was taken out on this home.
Original Mortgage
$284,905
Interest Rate
4.37%
Mortgage Type
New Conventional
Purchase Details
Closed on
Sep 26, 2006
Sold by
Jara Tarquino
Bought by
Crumpton Neil and Simek Julie
Home Financials for this Owner
Home Financials are based on the most recent Mortgage that was taken out on this home.
Original Mortgage
$268,000
Interest Rate
6.5%
Mortgage Type
Unknown
Create a Home Valuation Report for This Property
The Home Valuation Report is an in-depth analysis detailing your home's value as well as a comparison with similar homes in the area
Home Values in the Area
Average Home Value in this Area
Purchase History
| Date | Buyer | Sale Price | Title Company |
|---|---|---|---|
| Brittany Zwicker Revocable Living Trust | -- | None Listed On Document | |
| Meyers Brian S | $300,000 | Chicago Title | |
| Crumpton Neil | $335,000 | None Available |
Source: Public Records
Mortgage History
| Date | Status | Borrower | Loan Amount |
|---|---|---|---|
| Previous Owner | Meyers Brian S | $284,905 | |
| Previous Owner | Crumpton Neil | $268,000 |
Source: Public Records
Tax History Compared to Growth
Tax History
| Year | Tax Paid | Tax Assessment Tax Assessment Total Assessment is a certain percentage of the fair market value that is determined by local assessors to be the total taxable value of land and additions on the property. | Land | Improvement |
|---|---|---|---|---|
| 2024 | $6,074 | $24,633 | $6,531 | $18,102 |
| 2023 | $5,899 | $32,000 | $5,225 | $26,775 |
| 2022 | $5,899 | $32,000 | $5,225 | $26,775 |
| 2021 | $5,784 | $31,999 | $5,224 | $26,775 |
| 2020 | $5,288 | $26,760 | $2,705 | $24,055 |
| 2019 | $5,354 | $29,989 | $2,705 | $27,284 |
| 2018 | $5,262 | $29,989 | $2,705 | $27,284 |
| 2017 | $5,017 | $26,603 | $2,425 | $24,178 |
| 2016 | $4,844 | $26,603 | $2,425 | $24,178 |
| 2015 | $4,410 | $26,603 | $2,425 | $24,178 |
| 2014 | $4,303 | $25,673 | $2,239 | $23,434 |
| 2013 | $4,206 | $25,673 | $2,239 | $23,434 |
Source: Public Records
Map
Nearby Homes
- 4900 N Lawndale Ave Unit G
- 4901 N Avers Ave Unit 2
- 4919 N Lawndale Ave
- 5007 N Lawndale Ave
- 3849 W Ainslie St Unit 1
- 4903 N Monticello Ave Unit 3
- 3618 W Ainslie St Unit 3W
- 4855 N Springfield Ave Unit 3
- 4938 N Central Park Ave
- 3908 W Ainslie St Unit G
- 3711 W Lawrence Ave
- 4855 N Harding Ave Unit 2
- 3752 W Giddings St Unit 3
- 4833 N Harding Ave Unit GDN
- 4833 N Harding Ave Unit 1
- 4906 N Drake Ave Unit 3
- 5107 N Springfield Ave Unit B
- 5115 N Springfield Ave Unit B
- 4923 N Pulaski Rd
- 5038 N Harding Ave
- 4940 N Ridgeway Ave Unit 2
- 4936 N Ridgeway Ave
- 4944 N Ridgeway Ave Unit 3
- 4944 N Ridgeway Ave
- 4944 N Ridgeway Ave Unit 4
- 4946 N Ridgeway Ave Unit 3R
- 4946 N Ridgeway Ave Unit 2R
- 4946 N Ridgeway Ave Unit 1R
- 4948 N Ridgeway Ave Unit 2
- 4948 N Ridgeway Ave Unit 3
- 4948 N Ridgeway Ave
- 4932 N Ridgeway Ave Unit 1
- 4932 N Ridgeway Ave Unit 3
- 4932 N Ridgeway Ave Unit 2
- 4932 N Ridgeway Ave
- 4932 N Ridgeway Ave
- 4930 N Ridgeway Ave
- 4954 N Ridgeway Ave Unit 49541
- 4954 N Ridgeway Ave Unit 49542
- 4954 N Ridgeway Ave Unit 49543