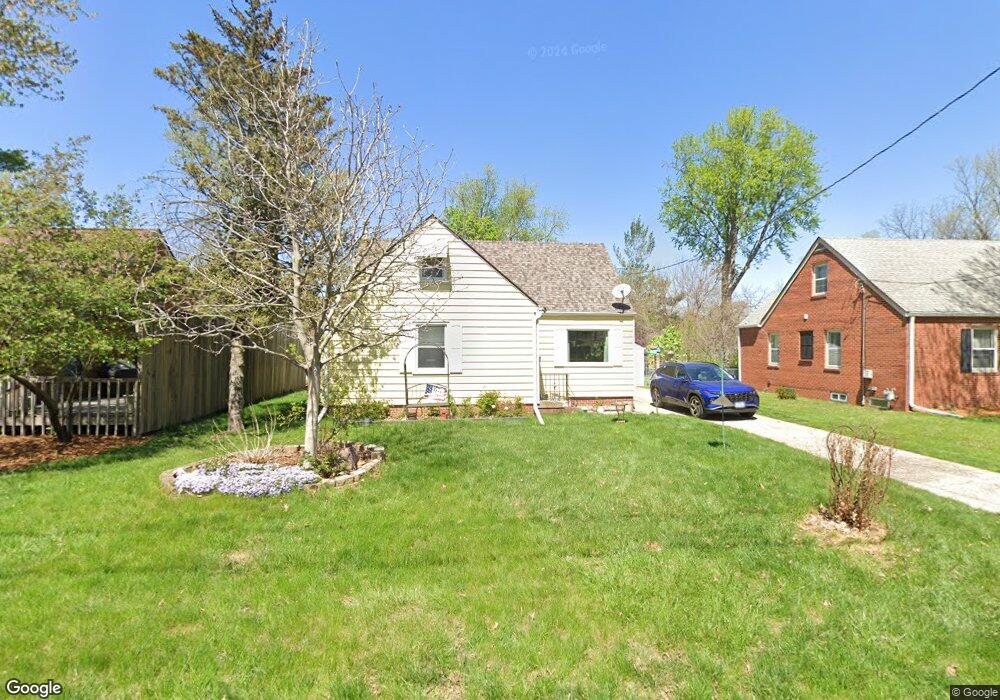
4941 Holcomb Ave Des Moines, IA 50310
Merle Hay NeighborhoodEstimated Value: $258,677 - $324,000
3
Beds
3
Baths
1,653
Sq Ft
$168/Sq Ft
Est. Value
About This Home
This home is located at 4941 Holcomb Ave, Des Moines, IA 50310 and is currently estimated at $277,669, approximately $167 per square foot. 4941 Holcomb Ave is a home located in Polk County with nearby schools including Hillis Elementary School, Meredith Middle School, and Hoover High School.
Ownership History
Date
Name
Owned For
Owner Type
Purchase Details
Closed on
Mar 9, 1998
Sold by
Carlson Lyle and Carlson Mary
Bought by
Cox Larry L and Cox Linda J
Current Estimated Value
Home Financials for this Owner
Home Financials are based on the most recent Mortgage that was taken out on this home.
Original Mortgage
$70,000
Outstanding Balance
$12,381
Interest Rate
6.99%
Estimated Equity
$265,288
Purchase Details
Closed on
Feb 21, 1998
Sold by
Abrahamson Kent B and Abrahamson Lynn Marie
Bought by
Cox Larry J and Cox Linda J
Home Financials for this Owner
Home Financials are based on the most recent Mortgage that was taken out on this home.
Original Mortgage
$70,000
Outstanding Balance
$12,381
Interest Rate
6.99%
Estimated Equity
$265,288
Create a Home Valuation Report for This Property
The Home Valuation Report is an in-depth analysis detailing your home's value as well as a comparison with similar homes in the area
Home Values in the Area
Average Home Value in this Area
Purchase History
| Date | Buyer | Sale Price | Title Company |
|---|---|---|---|
| Cox Larry L | -- | -- | |
| Cox Larry J | $89,500 | -- |
Source: Public Records
Mortgage History
| Date | Status | Borrower | Loan Amount |
|---|---|---|---|
| Open | Cox Larry J | $70,000 |
Source: Public Records
Tax History Compared to Growth
Tax History
| Year | Tax Paid | Tax Assessment Tax Assessment Total Assessment is a certain percentage of the fair market value that is determined by local assessors to be the total taxable value of land and additions on the property. | Land | Improvement |
|---|---|---|---|---|
| 2025 | $3,614 | $233,200 | $48,100 | $185,100 |
| 2024 | $3,614 | $209,800 | $42,600 | $167,200 |
| 2023 | $3,842 | $209,800 | $42,600 | $167,200 |
| 2022 | $3,810 | $175,300 | $37,100 | $138,200 |
| 2021 | $3,742 | $175,300 | $37,100 | $138,200 |
| 2020 | $3,880 | $161,800 | $34,100 | $127,700 |
| 2019 | $3,548 | $161,800 | $34,100 | $127,700 |
| 2018 | $3,504 | $143,800 | $29,700 | $114,100 |
| 2017 | $3,278 | $143,800 | $29,700 | $114,100 |
| 2016 | $3,188 | $133,000 | $27,100 | $105,900 |
| 2015 | $3,188 | $133,000 | $27,100 | $105,900 |
| 2014 | $2,906 | $121,400 | $24,300 | $97,100 |
Source: Public Records
Map
Nearby Homes
- 2710 50th St
- 2520 49th St
- 2712 49th St
- 2401 49th Place
- 2412 48th Place
- 2505 48th Place
- 2301 50th St
- 2829 49th St
- 2223 51st St
- 2111 51st St
- 2800 54th St
- 3019 49th St
- 5521 Sheridan Ave
- 5301 Urbandale Ave
- 5327 Urbandale Ave
- 3112 52nd St
- 5616 New York Ave
- 2021 48th St
- 1900 50th St Unit 9
- 5027 Franklin Ave