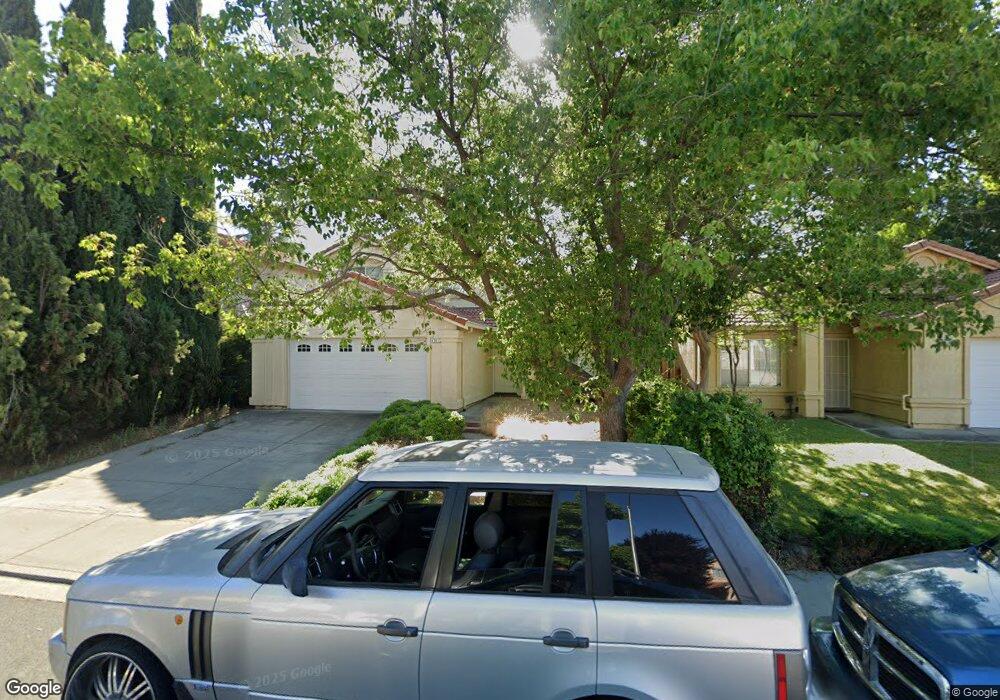
4941 Lefebvre Way Antioch, CA 94531
Country Hills NeighborhoodEstimated Value: $499,000 - $620,000
3
Beds
3
Baths
1,785
Sq Ft
$325/Sq Ft
Est. Value
About This Home
This home is located at 4941 Lefebvre Way, Antioch, CA 94531 and is currently estimated at $579,797, approximately $324 per square foot. 4941 Lefebvre Way is a home located in Contra Costa County with nearby schools including Carmen Dragon Elementary School, Black Diamond Middle School, and Deer Valley High School.
Ownership History
Date
Name
Owned For
Owner Type
Purchase Details
Closed on
Nov 4, 2015
Sold by
Fannie Mae
Bought by
Wibowo Tedy
Current Estimated Value
Home Financials for this Owner
Home Financials are based on the most recent Mortgage that was taken out on this home.
Original Mortgage
$276,800
Outstanding Balance
$217,272
Interest Rate
3.73%
Mortgage Type
New Conventional
Estimated Equity
$362,525
Purchase Details
Closed on
Sep 11, 2014
Sold by
Sol Juan E M
Bought by
Federal National Mortgage Association
Purchase Details
Closed on
Jul 28, 2005
Sold by
Matalsol Fatima D
Bought by
Matalsol Juan E
Home Financials for this Owner
Home Financials are based on the most recent Mortgage that was taken out on this home.
Original Mortgage
$357,000
Interest Rate
5.22%
Mortgage Type
Purchase Money Mortgage
Create a Home Valuation Report for This Property
The Home Valuation Report is an in-depth analysis detailing your home's value as well as a comparison with similar homes in the area
Home Values in the Area
Average Home Value in this Area
Purchase History
| Date | Buyer | Sale Price | Title Company |
|---|---|---|---|
| Wibowo Tedy | $346,000 | Servicelink | |
| Federal National Mortgage Association | $399,102 | First American Title Ins Co | |
| Matalsol Juan E | -- | First American Title |
Source: Public Records
Mortgage History
| Date | Status | Borrower | Loan Amount |
|---|---|---|---|
| Open | Wibowo Tedy | $276,800 | |
| Previous Owner | Matalsol Juan E | $357,000 |
Source: Public Records
Tax History Compared to Growth
Tax History
| Year | Tax Paid | Tax Assessment Tax Assessment Total Assessment is a certain percentage of the fair market value that is determined by local assessors to be the total taxable value of land and additions on the property. | Land | Improvement |
|---|---|---|---|---|
| 2025 | $3,680 | $302,009 | $97,244 | $204,765 |
| 2024 | $3,545 | $296,088 | $95,338 | $200,750 |
| 2023 | $3,545 | $290,283 | $93,469 | $196,814 |
| 2022 | $3,493 | $284,592 | $91,637 | $192,955 |
| 2021 | $3,387 | $279,013 | $89,841 | $189,172 |
| 2019 | $3,302 | $270,739 | $87,177 | $183,562 |
| 2018 | $3,184 | $265,431 | $85,468 | $179,963 |
| 2017 | $3,115 | $260,228 | $83,793 | $176,435 |
| 2016 | $3,033 | $255,126 | $82,150 | $172,976 |
| 2015 | $3,228 | $251,295 | $80,917 | $170,378 |
| 2014 | $3,957 | $246,373 | $79,332 | $167,041 |
Source: Public Records
Map
Nearby Homes
- 4866 Vinewood Way
- 4848 Pineview Way
- 4816 Chism Way
- 5124 Longdale Ct
- 5137 Twincreek Ct
- 4813 Silver Hill Ct
- 4671 Copper Hill Ct
- 5213 Walker Ct
- 5041 Wagon Wheel Way
- 5115 Equestrian Ct
- 5305 Cardinal St
- 5004 Havenrock Ct
- 5021 Wagon Wheel Way
- 4651 Shetland Way
- 5401 Mountain Ridge Way
- 5052 Perry Way
- 5000 Morgan Way
- 5132 Pioneer Way
- 5447 Benttree Way
- 5165 Hereford Way
- 4945 Lefebvre Way
- 4937 Lefebvre Way
- 4949 Lefebvre Way
- 4933 Lefebvre Way
- 5013 Woodmont Way
- 5017 Woodmont Way
- 4953 Lefebvre Way
- 4929 Lefebvre Way
- 5005 Woodmont Way
- 4940 Lefebvre Way
- 4936 Lefebvre Way
- 4944 Lefebvre Way
- 5021 Woodmont Way
- 4948 Lefebvre Way
- 4930 Lefebvre Way
- 4925 Lefebvre Way
- 4957 Lefebvre Way
- 5001 Woodmont Way
- 4952 Lefebvre Way
- 4926 Lefebvre Way