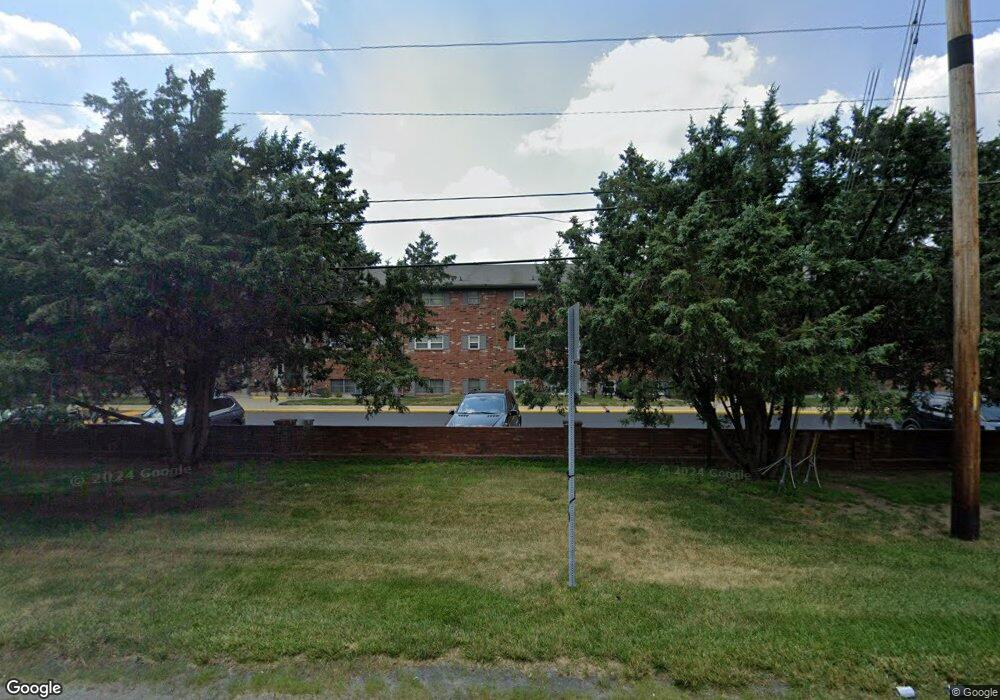
4942 Allisonville Rd Unit D Indianapolis, IN 46205
Millersville NeighborhoodEstimated Value: $141,000 - $160,000
4
Beds
2
Baths
1,788
Sq Ft
$83/Sq Ft
Est. Value
About This Home
This home is located at 4942 Allisonville Rd Unit D, Indianapolis, IN 46205 and is currently estimated at $148,163, approximately $82 per square foot. 4942 Allisonville Rd Unit D is a home located in Marion County with nearby schools including Clearwater Elementary School, Eastwood Middle School, and North Central High School.
Ownership History
Date
Name
Owned For
Owner Type
Purchase Details
Closed on
Oct 4, 2024
Sold by
Silva Raimundo Nilton
Bought by
Terman Valerie
Current Estimated Value
Purchase Details
Closed on
Apr 8, 2022
Sold by
Valerie Terman
Bought by
Terman Valerie and Silva Raimundo Nilton
Purchase Details
Closed on
Mar 2, 2022
Sold by
Sheriff Of Marion County
Bought by
Galliher Marla Jo and Galliher Keith Neal
Purchase Details
Closed on
Jun 8, 2021
Sold by
Auditor Of Marion County
Bought by
S & C Financial Group Llc
Purchase Details
Closed on
Jun 19, 2018
Sold by
Greymorr Real Estate Llc
Bought by
Galliher Marla Jo and Galliher Neal Keith
Purchase Details
Closed on
Feb 15, 2017
Sold by
Voorhies Julie L
Purchase Details
Closed on
Dec 31, 2016
Sold by
Nebraska Alliance Reality Co
Bought by
Greymorr Real Estate Llc
Create a Home Valuation Report for This Property
The Home Valuation Report is an in-depth analysis detailing your home's value as well as a comparison with similar homes in the area
Home Values in the Area
Average Home Value in this Area
Purchase History
| Date | Buyer | Sale Price | Title Company |
|---|---|---|---|
| Terman Valerie | -- | None Listed On Document | |
| Terman Valerie | -- | None Listed On Document | |
| Galliher Marla Jo | $59,762 | Earnhart Steven C | |
| S & C Financial Group Llc | $25,000 | None Listed On Document | |
| Galliher Marla Jo | -- | None Available | |
| -- | $18,000 | -- | |
| Nebraska Alliance Realty Co | $18,000 | Marion Co Auditor | |
| Greymorr Real Estate Llc | -- | -- |
Source: Public Records
Tax History Compared to Growth
Tax History
| Year | Tax Paid | Tax Assessment Tax Assessment Total Assessment is a certain percentage of the fair market value that is determined by local assessors to be the total taxable value of land and additions on the property. | Land | Improvement |
|---|---|---|---|---|
| 2024 | $1,276 | $129,900 | $41,500 | $88,400 |
| 2023 | $1,276 | $129,900 | $41,500 | $88,400 |
| 2022 | $776 | $89,200 | $32,700 | $56,500 |
| 2021 | $2,360 | $88,100 | $32,300 | $55,800 |
| 2020 | $2,165 | $85,200 | $31,700 | $53,500 |
| 2019 | $2,036 | $85,100 | $31,400 | $53,700 |
| 2018 | $1,706 | $72,600 | $28,800 | $43,800 |
| 2017 | $1,609 | $69,200 | $28,100 | $41,100 |
| 2016 | $1,170 | $53,400 | $24,500 | $28,900 |
| 2014 | $1,086 | $55,700 | $24,700 | $31,000 |
| 2013 | $1,489 | $71,700 | $27,800 | $43,900 |
Source: Public Records
Map
Nearby Homes
- 5026 Allisonville Rd Unit C
- 3016 Lake Shore Dr Unit B
- 2841 Tropical Dr
- 3214 E 52nd St
- 4511 N Dearborn St
- 4502 N Dearborn St
- 4909 Brouse Ave
- 5001 Hillside Ave
- 2220 E 46th St
- 4843 Caroline Ave
- 5168 Caroline Ave
- 4720 Mallard View Dr
- 5078 Evanston Ave
- 5145 Crittenden Ave
- 5629 N Rural St
- 4723 Crittenden Ave
- 4622 Evanston Ave
- 5305 Evanston Ave
- 2626 Northview Ave
- 4931 Norwaldo Ave
- 4942 Allisonville Rd Unit A
- 4942 Allisonville Rd
- 4942 Allisonville Rd
- 4942 Allisonville Rd
- 4942 Allisonville Rd
- 4942 Allisonville Rd
- 4942 Allisonville Rd Unit 4942E
- 4942 Allisonville Rd Unit B
- 4942 Allisonville Rd Unit F
- 4942 Allisonville Rd Unit E
- 4942 Allisonville Rd Unit C
- 4942 Allisonville B
- 4940 Allisonville Rd Unit A
- 4940 Allisonville Rd Unit E
- 4940 Allisonville Rd
- 4940 Allisonville Rd
- 4940 Allisonville Rd
- 4940 Allisonville Rd Unit 4940E
- 4940 Allisonville Rd
- 4940 Allisonville Rd