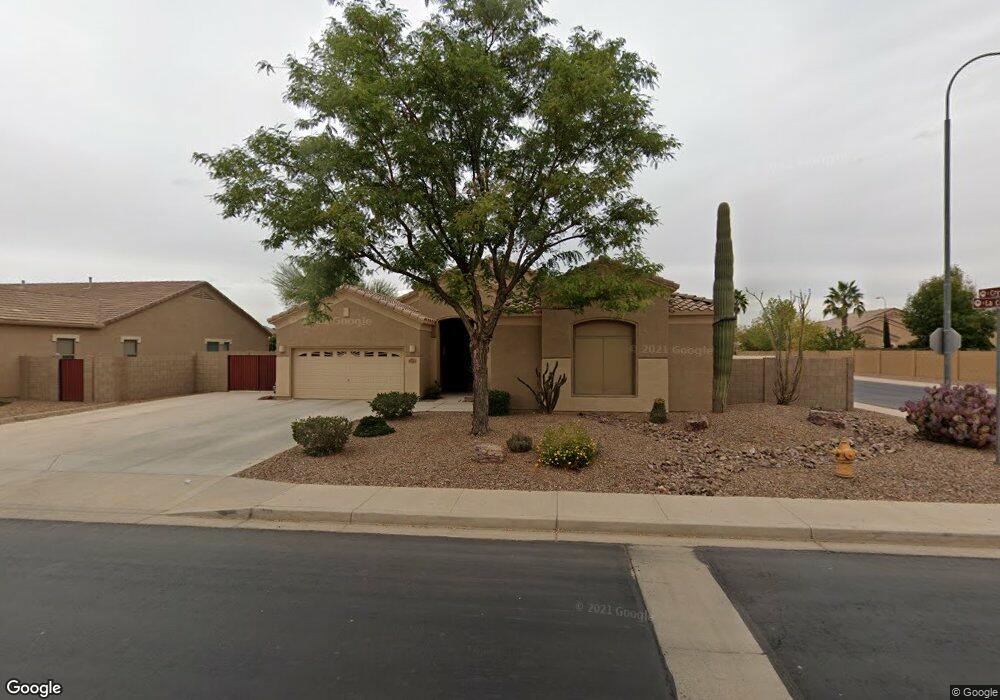
4942 E La Costa Dr Chandler, AZ 85249
Sun Groves NeighborhoodEstimated Value: $572,636 - $608,000
Studio
3
Baths
2,393
Sq Ft
$248/Sq Ft
Est. Value
About This Home
This home is located at 4942 E La Costa Dr, Chandler, AZ 85249 and is currently estimated at $593,409, approximately $247 per square foot. 4942 E La Costa Dr is a home located in Maricopa County with nearby schools including Navarrete Elementary School, Willie & Coy Payne Jr. High School, and Rice Elementary School.
Ownership History
Date
Name
Owned For
Owner Type
Purchase Details
Closed on
Nov 10, 2010
Sold by
Mullens James M and Mullens Lynn R
Bought by
Mullens James M and Mullens Lynn R
Current Estimated Value
Home Financials for this Owner
Home Financials are based on the most recent Mortgage that was taken out on this home.
Original Mortgage
$135,000
Outstanding Balance
$46,234
Interest Rate
4.17%
Mortgage Type
New Conventional
Estimated Equity
$547,175
Purchase Details
Closed on
May 13, 2004
Sold by
Mullens James M and Mullens Lynn R
Bought by
Mullens James M and Mullens Lynn R
Purchase Details
Closed on
May 29, 2003
Sold by
First American Title Insurance Co
Bought by
Mullens James and Mullens Lynn R
Home Financials for this Owner
Home Financials are based on the most recent Mortgage that was taken out on this home.
Original Mortgage
$161,837
Interest Rate
5.53%
Mortgage Type
New Conventional
Create a Home Valuation Report for This Property
The Home Valuation Report is an in-depth analysis detailing your home's value as well as a comparison with similar homes in the area
Home Values in the Area
Average Home Value in this Area
Purchase History
| Date | Buyer | Sale Price | Title Company |
|---|---|---|---|
| Mullens James M | -- | Stewart Title & Trust Of Pho | |
| Mullens James M | -- | Stewart Title & Trust Of Pho | |
| Mullens James M | -- | -- | |
| Mullens James | $202,297 | First American Title Ins Co |
Source: Public Records
Mortgage History
| Date | Status | Borrower | Loan Amount |
|---|---|---|---|
| Open | Mullens James M | $135,000 | |
| Closed | Mullens James | $161,837 |
Source: Public Records
Tax History
| Year | Tax Paid | Tax Assessment Tax Assessment Total Assessment is a certain percentage of the fair market value that is determined by local assessors to be the total taxable value of land and additions on the property. | Land | Improvement |
|---|---|---|---|---|
| 2025 | $2,416 | $30,347 | -- | -- |
| 2024 | $2,335 | $28,902 | -- | -- |
| 2023 | $2,335 | $45,810 | $9,160 | $36,650 |
| 2022 | $2,255 | $33,780 | $6,750 | $27,030 |
| 2021 | $2,353 | $31,480 | $6,290 | $25,190 |
| 2020 | $2,340 | $29,480 | $5,890 | $23,590 |
| 2019 | $2,252 | $27,000 | $5,400 | $21,600 |
| 2018 | $2,179 | $25,720 | $5,140 | $20,580 |
| 2017 | $2,033 | $25,170 | $5,030 | $20,140 |
| 2016 | $1,959 | $24,900 | $4,980 | $19,920 |
| 2015 | $1,894 | $23,850 | $4,770 | $19,080 |
Source: Public Records
Map
Nearby Homes
- 4995 E Indian Wells Dr
- 4960 E Colonial Dr
- 6300 S Black Hills Way
- 4875 E Bellerive Dr
- 4632 E Desert Sands Dr
- 4795 E Bellerive Dr
- 4633 E Desert Sands Dr
- 4613 E Cherry Hills Dr
- 4662 E Cherry Hills Dr
- 6030 S Agate Place
- 6922 S Black Hills Way
- 1928 E La Costa Dr
- 1867 E Gillcrest Rd
- 1966 E Indian Wells Dr
- 1978 E Indian Wells Dr
- 4253 E Colonial Dr
- 1866 E Ravenswood Dr
- 4450 E Gemini Place
- 1997 E Flintlock Dr
- 2033 E Saddlebrook Rd
- 4932 E La Costa Dr
- 4941 E Runaway Bay Dr
- 4962 E La Costa Dr
- 4931 E Runaway Bay Dr
- 4943 E La Costa Dr
- 4922 E La Costa Dr
- 4953 E La Costa Dr
- 4961 E Runaway Bay Dr
- 4921 E Runaway Bay Dr
- 4933 E La Costa Dr
- 4963 E La Costa Dr
- 4972 E La Costa Dr
- 4923 E La Costa Dr
- 4971 E Runaway Bay Dr
- 4901 E Runaway Bay Dr
- 4973 E La Costa Dr
- 4912 E La Costa Dr
- 4982 E La Costa Dr
- 4940 E Runaway Bay Dr
- 4944 E Indian Wells Dr
Your Personal Tour Guide
Ask me questions while you tour the home.