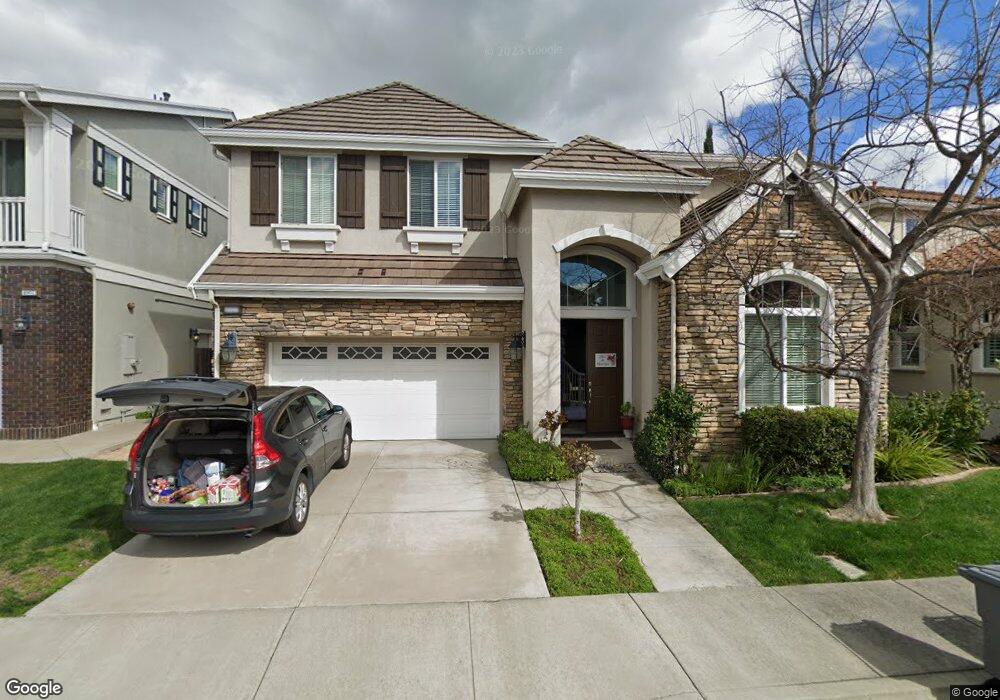
4943 Piper Glen Terrace Dublin, CA 94568
Dublin Ranch NeighborhoodEstimated Value: $1,816,000 - $2,186,000
4
Beds
3
Baths
2,930
Sq Ft
$694/Sq Ft
Est. Value
About This Home
This home is located at 4943 Piper Glen Terrace, Dublin, CA 94568 and is currently estimated at $2,032,018, approximately $693 per square foot. 4943 Piper Glen Terrace is a home located in Alameda County with nearby schools including J.M. Amador Elementary School, Dublin High School, and The Quarry Lane School.
Ownership History
Date
Name
Owned For
Owner Type
Purchase Details
Closed on
Mar 29, 2017
Sold by
Marts Bruce A and Marts Sharon Z
Bought by
Mohammed Ali Mujahed and Sammanasu Edlyn V
Current Estimated Value
Home Financials for this Owner
Home Financials are based on the most recent Mortgage that was taken out on this home.
Original Mortgage
$660,000
Outstanding Balance
$530,054
Interest Rate
3%
Mortgage Type
Adjustable Rate Mortgage/ARM
Estimated Equity
$1,501,964
Purchase Details
Closed on
Jul 30, 2003
Sold by
Toll Ca Ii Lp
Bought by
Zint Marts Bruce Allyn and Zint Marts Sharon
Home Financials for this Owner
Home Financials are based on the most recent Mortgage that was taken out on this home.
Original Mortgage
$586,245
Interest Rate
4.25%
Mortgage Type
Purchase Money Mortgage
Create a Home Valuation Report for This Property
The Home Valuation Report is an in-depth analysis detailing your home's value as well as a comparison with similar homes in the area
Home Values in the Area
Average Home Value in this Area
Purchase History
| Date | Buyer | Sale Price | Title Company |
|---|---|---|---|
| Mohammed Ali Mujahed | $1,100,000 | First American Title Company | |
| Zint Marts Bruce Allyn | $733,000 | -- |
Source: Public Records
Mortgage History
| Date | Status | Borrower | Loan Amount |
|---|---|---|---|
| Open | Mohammed Ali Mujahed | $660,000 | |
| Previous Owner | Zint Marts Bruce Allyn | $586,245 | |
| Closed | Zint Marts Bruce Allyn | $73,280 |
Source: Public Records
Tax History Compared to Growth
Tax History
| Year | Tax Paid | Tax Assessment Tax Assessment Total Assessment is a certain percentage of the fair market value that is determined by local assessors to be the total taxable value of land and additions on the property. | Land | Improvement |
|---|---|---|---|---|
| 2025 | $16,833 | $1,276,615 | $382,984 | $893,631 |
| 2024 | $16,833 | $1,251,590 | $375,477 | $876,113 |
| 2023 | $16,659 | $1,227,050 | $368,115 | $858,935 |
| 2022 | $16,460 | $1,202,992 | $360,897 | $842,095 |
| 2021 | $16,321 | $1,179,408 | $353,822 | $825,586 |
| 2020 | $15,275 | $1,167,320 | $350,196 | $817,124 |
| 2019 | $15,292 | $1,144,440 | $343,332 | $801,108 |
| 2018 | $14,939 | $1,122,000 | $336,600 | $785,400 |
| 2017 | $12,204 | $897,693 | $269,381 | $628,312 |
| 2016 | $11,133 | $880,091 | $264,099 | $615,992 |
| 2015 | $10,739 | $866,872 | $260,132 | $606,740 |
| 2014 | $10,754 | $849,893 | $255,037 | $594,856 |
Source: Public Records
Map
Nearby Homes
- 4986 Grayhawk Ct
- 2371 Capistrello St
- 3956 Jordan Ranch Dr
- 3970 Jordan Ranch Dr
- 3005 Vittoria Loop
- 2528 Amantea Way
- 3105 Vittoria Loop
- 4456 Sunset View Dr
- 2378 Carbondale Way
- 3135 Vittoria Loop
- 4439 Sunset View Dr
- 4369 Table Mountain Rd
- 2336 Carbondale Way
- 2848 E Cog Hill Terrace
- 4287 Loyalton Rd
- 4228 Loyalton Rd
- 1937 Whitney Ave
- 2100 Carbondale Cir
- 1856 S Terracina Dr
- 1691 S Wren St
- 4957 Piper Glen Terrace
- 4929 Piper Glen Terrace
- 4915 Piper Glen Terrace
- 4971 Piper Glen Terrace
- 4944 Piper Glen Terrace
- 4930 Piper Glen Terrace
- 4897 Piper Glen Terrace
- 4983 Piper Glen Terrace
- 2683 N Kilbride Ln
- 4916 Piper Glen Terrace
- 2697 N Kilbride Ln
- 2706 N Kilbride Ln
- 4883 Piper Glen Terrace
- 4999 Piper Glen Terrace
- 2684 Eagles Landing Ct
- 4899 Landmark Way
- 2715 N Kilbride Ln
- 4882 Piper Glen Terrace
- 5781 Fallon Rd
- 2730 N Kilbride Ln