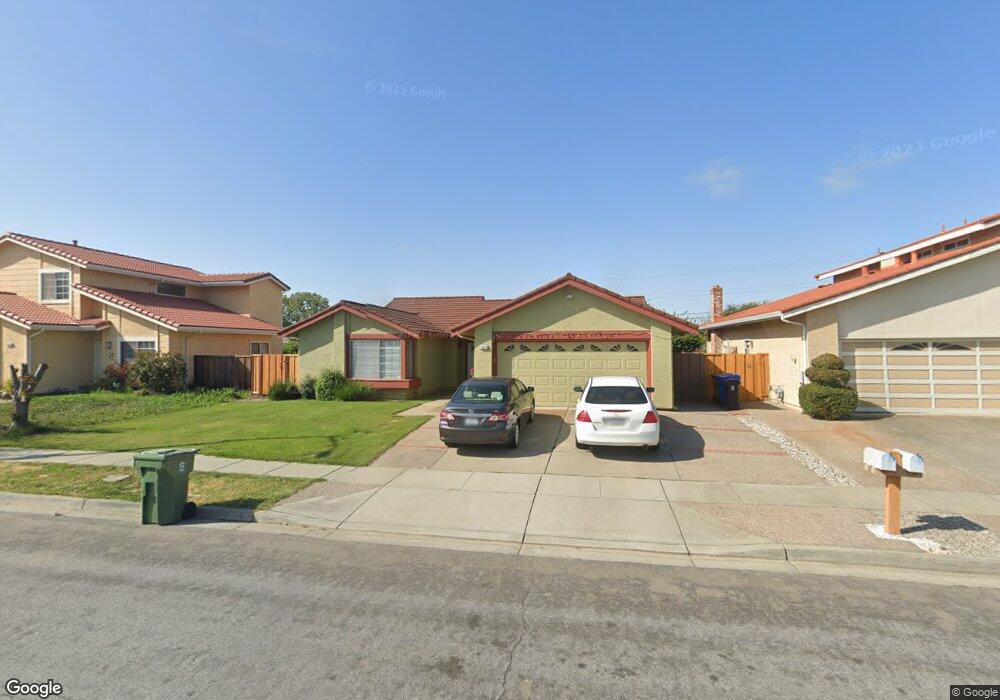
4943 Seneca Park Loop Fremont, CA 94538
Blacow NeighborhoodEstimated Value: $1,148,000 - $1,758,000
3
Beds
2
Baths
1,504
Sq Ft
$1,003/Sq Ft
Est. Value
About This Home
This home is located at 4943 Seneca Park Loop, Fremont, CA 94538 and is currently estimated at $1,508,987, approximately $1,003 per square foot. 4943 Seneca Park Loop is a home located in Alameda County with nearby schools including Steven Millard Elementary, G.M. Walters Middle School, and John F. Kennedy High School.
Ownership History
Date
Name
Owned For
Owner Type
Purchase Details
Closed on
Dec 21, 2004
Sold by
Montinola Isabelita J and Ledesma Conchita A
Bought by
Thind Surinder S and Thind Raj K
Current Estimated Value
Home Financials for this Owner
Home Financials are based on the most recent Mortgage that was taken out on this home.
Original Mortgage
$487,200
Outstanding Balance
$242,201
Interest Rate
5.62%
Mortgage Type
Purchase Money Mortgage
Estimated Equity
$1,266,786
Purchase Details
Closed on
Jan 19, 1997
Sold by
Montinola Isabelita J Ledesma Conchita
Bought by
Montinola Isabelita J and Ledesma Conchita A
Create a Home Valuation Report for This Property
The Home Valuation Report is an in-depth analysis detailing your home's value as well as a comparison with similar homes in the area
Home Values in the Area
Average Home Value in this Area
Purchase History
| Date | Buyer | Sale Price | Title Company |
|---|---|---|---|
| Thind Surinder S | $609,000 | Multiple | |
| Montinola Isabelita J | -- | -- |
Source: Public Records
Mortgage History
| Date | Status | Borrower | Loan Amount |
|---|---|---|---|
| Open | Thind Surinder S | $487,200 | |
| Closed | Thind Surinder S | $30,400 |
Source: Public Records
Tax History Compared to Growth
Tax History
| Year | Tax Paid | Tax Assessment Tax Assessment Total Assessment is a certain percentage of the fair market value that is determined by local assessors to be the total taxable value of land and additions on the property. | Land | Improvement |
|---|---|---|---|---|
| 2025 | $10,174 | $841,811 | $254,643 | $594,168 |
| 2024 | $10,174 | $825,173 | $249,652 | $582,521 |
| 2023 | $9,901 | $815,858 | $244,757 | $571,101 |
| 2022 | $9,772 | $792,866 | $239,960 | $559,906 |
| 2021 | $9,532 | $777,184 | $235,255 | $548,929 |
| 2020 | $9,558 | $776,145 | $232,843 | $543,302 |
| 2019 | $9,448 | $760,932 | $228,279 | $532,653 |
| 2018 | $9,264 | $746,018 | $223,805 | $522,213 |
| 2017 | $9,031 | $731,396 | $219,419 | $511,977 |
| 2016 | $8,877 | $717,060 | $215,118 | $501,942 |
| 2015 | $8,345 | $671,000 | $201,300 | $469,700 |
| 2014 | $7,629 | $608,000 | $182,400 | $425,600 |
Source: Public Records
Map
Nearby Homes
- 43163 Grimmer Terrace
- 48 Eagle Green
- 4860 Bryce Canyon Park Dr
- 92 Delta Green
- 5560 Boscell Common
- 42932 Peachwood St
- 5341 Audubon Park Ct
- 4537 Capewood Terrace
- 4533 Capewood Terrace
- 4309 Bora Ave
- 202 Manitoba Terrace
- 208 Manitoba Terrace
- 262 Manitoba Green
- 4751 Wadsworth Ct
- 261 Manitoba Green Unit 261
- 257 Manitoba Green
- 41882 Gifford St
- 40696 Robin St
- 40422 Landon Ave
- 42759 Newport Dr
- 4949 Seneca Park Loop
- 4937 Seneca Park Loop
- 5033 Hyde Park Dr
- 4955 Seneca Park Loop
- 5025 Hyde Park Dr
- 4931 Seneca Park Loop
- 5049 Hyde Park Dr
- 5017 Hyde Park Dr
- 4946 Seneca Park Loop
- 4940 Seneca Park Loop
- 4957 Seneca Park Loop
- 4952 Seneca Park Loop
- 4925 Seneca Park Loop
- 4934 Seneca Park Loop
- 5057 Hyde Park Dr
- 5009 Hyde Park Dr
- 4958 Seneca Park Loop
- 4928 Seneca Park Loop
- 4959 Seneca Park Loop
- 5040 Hyde Park Dr