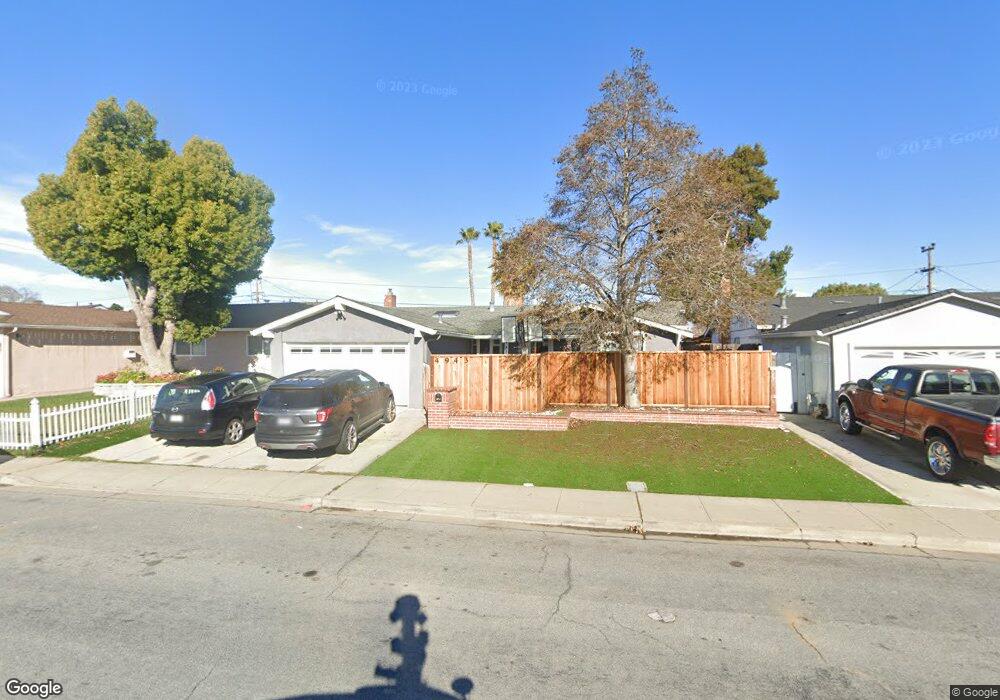
4943 Yellowstone Park Dr Fremont, CA 94538
Blacow NeighborhoodEstimated Value: $1,551,009 - $1,640,000
4
Beds
2
Baths
1,592
Sq Ft
$1,009/Sq Ft
Est. Value
About This Home
This home is located at 4943 Yellowstone Park Dr, Fremont, CA 94538 and is currently estimated at $1,606,502, approximately $1,009 per square foot. 4943 Yellowstone Park Dr is a home located in Alameda County with nearby schools including Steven Millard Elementary, G.M. Walters Middle School, and John F. Kennedy High School.
Ownership History
Date
Name
Owned For
Owner Type
Purchase Details
Closed on
Mar 6, 2017
Sold by
Samuels Bradford J and Samuels Bradford J
Bought by
Samuels Bradford J and Samuels 2017 Trust
Current Estimated Value
Purchase Details
Closed on
Jan 25, 2005
Sold by
Samuels Bradford J and Samuels Bradford J
Bought by
Samuels Bradford J
Home Financials for this Owner
Home Financials are based on the most recent Mortgage that was taken out on this home.
Original Mortgage
$230,000
Outstanding Balance
$116,829
Interest Rate
5.74%
Mortgage Type
New Conventional
Estimated Equity
$1,489,673
Purchase Details
Closed on
Apr 7, 1998
Sold by
Samuels Linda M and Samuels Linda
Bought by
Samuels Bradford J and Samuels Bradford J
Home Financials for this Owner
Home Financials are based on the most recent Mortgage that was taken out on this home.
Original Mortgage
$176,250
Interest Rate
7.07%
Create a Home Valuation Report for This Property
The Home Valuation Report is an in-depth analysis detailing your home's value as well as a comparison with similar homes in the area
Home Values in the Area
Average Home Value in this Area
Purchase History
| Date | Buyer | Sale Price | Title Company |
|---|---|---|---|
| Samuels Bradford J | -- | None Available | |
| Samuels Bradford J | -- | Financial Title Company | |
| Samuels Bradford J | -- | Commonwealth Land Title Co |
Source: Public Records
Mortgage History
| Date | Status | Borrower | Loan Amount |
|---|---|---|---|
| Open | Samuels Bradford J | $230,000 | |
| Previous Owner | Samuels Bradford J | $176,250 |
Source: Public Records
Tax History Compared to Growth
Tax History
| Year | Tax Paid | Tax Assessment Tax Assessment Total Assessment is a certain percentage of the fair market value that is determined by local assessors to be the total taxable value of land and additions on the property. | Land | Improvement |
|---|---|---|---|---|
| 2025 | $4,991 | $375,096 | $89,002 | $293,094 |
| 2024 | $4,991 | $367,604 | $87,257 | $287,347 |
| 2023 | $4,844 | $367,260 | $85,546 | $281,714 |
| 2022 | $4,763 | $353,059 | $83,869 | $276,190 |
| 2021 | $4,650 | $346,000 | $82,225 | $270,775 |
| 2020 | $4,604 | $349,380 | $81,381 | $267,999 |
| 2019 | $4,554 | $342,531 | $79,786 | $262,745 |
| 2018 | $4,462 | $335,816 | $78,222 | $257,594 |
| 2017 | $4,350 | $329,232 | $76,688 | $252,544 |
| 2016 | $3,798 | $275,778 | $75,185 | $200,593 |
| 2015 | $3,739 | $271,637 | $74,056 | $197,581 |
| 2014 | $3,668 | $266,317 | $72,606 | $193,711 |
Source: Public Records
Map
Nearby Homes
- 43163 Grimmer Terrace
- 48 Eagle Green
- 92 Delta Green
- 42932 Peachwood St
- 5560 Boscell Common
- 4860 Bryce Canyon Park Dr
- 202 Manitoba Terrace
- 208 Manitoba Terrace
- 4537 Capewood Terrace
- 4533 Capewood Terrace
- 262 Manitoba Green
- 261 Manitoba Green Unit 261
- 257 Manitoba Green
- 5341 Audubon Park Ct
- 4309 Bora Ave
- 4751 Wadsworth Ct
- 41882 Gifford St
- 40696 Robin St
- 42759 Newport Dr
- 40422 Landon Ave
- 4935 Yellowstone Park Dr
- 4951 Yellowstone Park Dr
- 4942 Hyde Park Dr
- 4950 Hyde Park Dr
- 4959 Yellowstone Park Dr
- 4927 Yellowstone Park Dr
- 4934 Hyde Park Dr
- 4958 Hyde Park Dr
- 4942 Yellowstone Park Dr
- 4948 Yellowstone Park Dr
- 4926 Hyde Park Dr
- 4936 Yellowstone Park Dr
- 4967 Yellowstone Park Dr
- 4919 Yellowstone Park Dr
- 4954 Yellowstone Park Dr
- 4966 Hyde Park Dr
- 4930 Yellowstone Park Dr
- 4960 Yellowstone Park Dr
- 4918 Hyde Park Dr
- 4975 Yellowstone Park Dr