4944 Singleton Dr Unit 7B Hilliard, OH 43026
Cross Creek NeighborhoodEstimated Value: $183,789 - $192,000
2
Beds
2
Baths
1,040
Sq Ft
$180/Sq Ft
Est. Value
About This Home
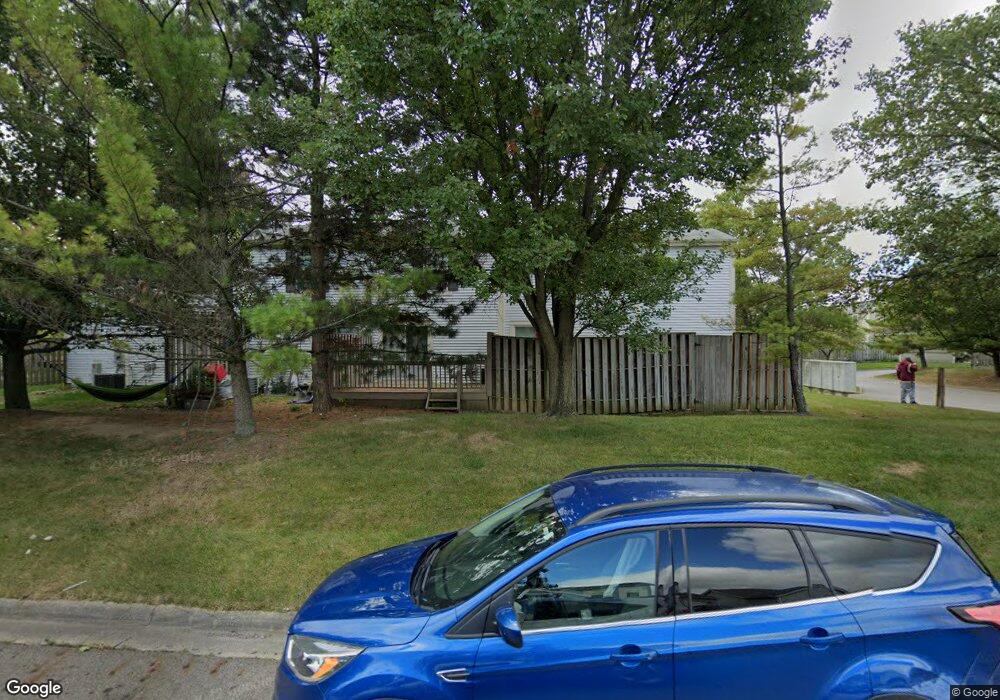
This home is located at 4944 Singleton Dr Unit 7B, Hilliard, OH 43026 and is currently estimated at $186,697, approximately $179 per square foot. 4944 Singleton Dr Unit 7B is a home located in Franklin County with nearby schools including Hilliard Crossing Elementary School, Hilliard Station Sixth Grade Elementary School, and Hilliard Heritage Middle School.
Ownership History
Date
Name
Owned For
Owner Type
Purchase Details
Closed on
Jul 31, 2015
Sold by
Adams Kathryn Gail
Bought by
Cummons David W
Current Estimated Value
Home Financials for this Owner
Home Financials are based on the most recent Mortgage that was taken out on this home.
Original Mortgage
$73,641
Outstanding Balance
$57,382
Interest Rate
4.08%
Mortgage Type
FHA
Estimated Equity
$129,315
Purchase Details
Closed on
May 24, 2006
Sold by
Sirva Relocation Llc
Bought by
Keachele Kathryn G
Home Financials for this Owner
Home Financials are based on the most recent Mortgage that was taken out on this home.
Original Mortgage
$77,500
Interest Rate
6.62%
Mortgage Type
Fannie Mae Freddie Mac
Purchase Details
Closed on
Jan 31, 2006
Sold by
Hall Larry F and Hall Thelma M
Bought by
Sirva Relocation Llc
Purchase Details
Closed on
Aug 2, 1993
Bought by
Hall Larry F
Purchase Details
Closed on
Aug 23, 1990
Create a Home Valuation Report for This Property
The Home Valuation Report is an in-depth analysis detailing your home's value as well as a comparison with similar homes in the area
Home Values in the Area
Average Home Value in this Area
Purchase History
| Date | Buyer | Sale Price | Title Company |
|---|---|---|---|
| Cummons David W | $75,000 | Attorney | |
| Keachele Kathryn G | $77,500 | Talon Group | |
| Sirva Relocation Llc | $77,500 | Talon Group | |
| Hall Larry F | $52,500 | -- | |
| -- | $47,100 | -- |
Source: Public Records
Mortgage History
| Date | Status | Borrower | Loan Amount |
|---|---|---|---|
| Open | Cummons David W | $73,641 | |
| Previous Owner | Keachele Kathryn G | $77,500 |
Source: Public Records
Tax History
| Year | Tax Paid | Tax Assessment Tax Assessment Total Assessment is a certain percentage of the fair market value that is determined by local assessors to be the total taxable value of land and additions on the property. | Land | Improvement |
|---|---|---|---|---|
| 2025 | $2,608 | $46,170 | $9,800 | $36,370 |
| 2024 | $2,608 | $46,170 | $9,800 | $36,370 |
| 2023 | $2,259 | $46,165 | $9,800 | $36,365 |
| 2022 | $2,278 | $37,280 | $4,590 | $32,690 |
| 2021 | $2,276 | $37,280 | $4,590 | $32,690 |
| 2020 | $2,269 | $37,280 | $4,590 | $32,690 |
| 2019 | $1,831 | $25,690 | $3,150 | $22,540 |
| 2018 | $1,693 | $25,690 | $3,150 | $22,540 |
| 2017 | $1,824 | $25,690 | $3,150 | $22,540 |
| 2016 | $1,620 | $21,140 | $3,080 | $18,060 |
| 2015 | $1,562 | $21,140 | $3,080 | $18,060 |
| 2014 | $1,521 | $21,140 | $3,080 | $18,060 |
| 2013 | $856 | $23,485 | $3,430 | $20,055 |
Source: Public Records
Map
Nearby Homes
- 5082 Singleton Dr Unit 29C
- 5034 Hidden View Dr
- 5160 Singleton Dr Unit 43D
- 2968 Phoenix Ave
- 5052 Bressler Dr
- 2505 Roberts Ct
- 5380 Carjan Way
- 2978 Bismark Dr
- 4976 Silver Bow Dr
- 5138 Roberts Rd
- 4920 Meadow Run Dr Unit 4920
- 5080 Springdale Blvd Unit 31F
- 5082 Springdale Blvd Unit 31E
- 5240 Citrus Dr
- 2464 Meadow Glade Dr Unit 2464
- 5080 Stoneybrook Blvd Unit 2D
- 2465 Meadow Glade Dr Unit 26
- 2477 Crystal Springs Dr
- 5265 Frisco Dr
- 2458 Crystal Springs Dr Unit 2458
- 4946 Singleton Dr Unit 7A
- 4942 Singleton Dr Unit 7C
- 4940 Singleton Dr
- 4940 Singleton Dr Unit 7D
- 4937 Singleton Dr Unit 11D
- 4935 Singleton Dr Unit 11C
- 4926 Singleton Dr Unit 6A
- 4901 Singleton Dr Unit 9A
- 4903 Singleton Dr
- 4903 Singleton Dr Unit 9B
- 4924 Singleton Dr Unit 6B
- 4933 Singleton Dr Unit 11B
- 4966 Singleton Dr Unit 12A
- 4964 Singleton Dr
- 4922 Singleton Dr Unit 6C
- 4960 Singleton Dr
- 4960 Singleton Dr Unit 12D
- 4931 Singleton Dr
- 4962 Singleton Dr
- 4905 Singleton Dr
Your Personal Tour Guide
Ask me questions while you tour the home.