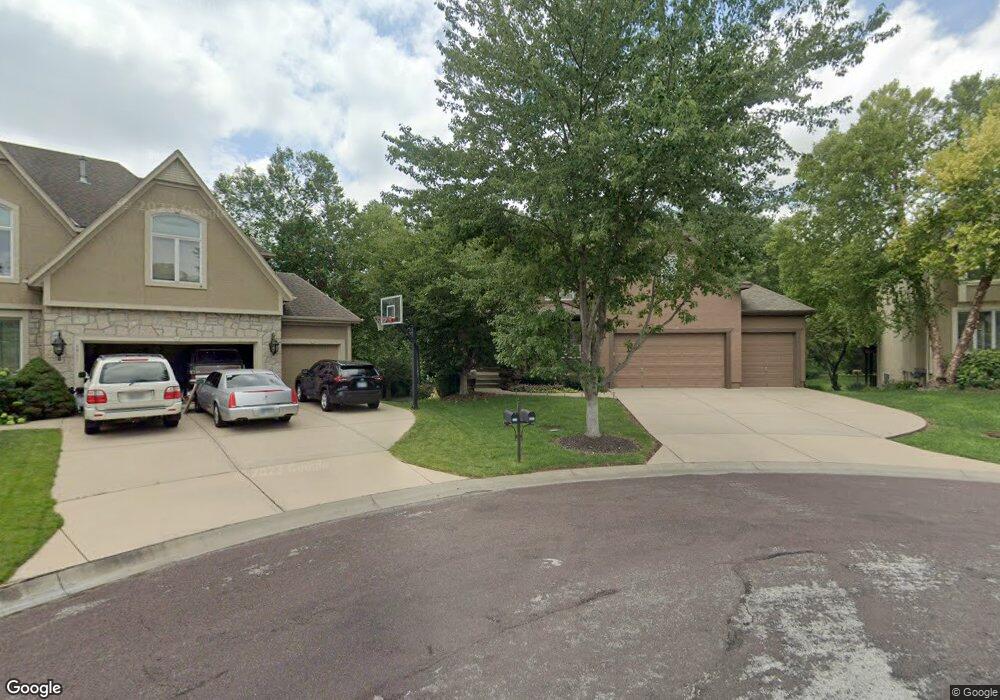
4945 W 162nd St Stilwell, KS 66085
Estimated Value: $611,295 - $643,000
4
Beds
5
Baths
2,794
Sq Ft
$225/Sq Ft
Est. Value
About This Home
This home is located at 4945 W 162nd St, Stilwell, KS 66085 and is currently estimated at $629,074, approximately $225 per square foot. 4945 W 162nd St is a home located in Johnson County with nearby schools including Blue River Elementary School, Blue Valley Middle School, and Blue Valley High School.
Ownership History
Date
Name
Owned For
Owner Type
Purchase Details
Closed on
Mar 11, 2005
Sold by
Hendrix Steven A and Hendrix Barbara L
Bought by
Hendrix Barbara L and Hendrix Steven A
Current Estimated Value
Purchase Details
Closed on
Sep 25, 2002
Sold by
Hendrix Steven A and Hendrix Barbara L
Bought by
Hendrix Steven A and Hendrix Barbara L
Home Financials for this Owner
Home Financials are based on the most recent Mortgage that was taken out on this home.
Original Mortgage
$274,500
Outstanding Balance
$113,743
Interest Rate
6.26%
Estimated Equity
$515,331
Purchase Details
Closed on
Jul 20, 2001
Sold by
Scott Custom Homes Lc
Bought by
Hendrix Steven A and Sutcliffe Barbara Lee
Home Financials for this Owner
Home Financials are based on the most recent Mortgage that was taken out on this home.
Original Mortgage
$274,500
Interest Rate
6.62%
Create a Home Valuation Report for This Property
The Home Valuation Report is an in-depth analysis detailing your home's value as well as a comparison with similar homes in the area
Home Values in the Area
Average Home Value in this Area
Purchase History
| Date | Buyer | Sale Price | Title Company |
|---|---|---|---|
| Hendrix Barbara L | -- | None Available | |
| Hendrix Steven A | -- | Old Republic Title | |
| Hendrix Steven A | -- | Security Land Title Company |
Source: Public Records
Mortgage History
| Date | Status | Borrower | Loan Amount |
|---|---|---|---|
| Open | Hendrix Steven A | $274,500 | |
| Closed | Hendrix Steven A | $274,500 |
Source: Public Records
Tax History
| Year | Tax Paid | Tax Assessment Tax Assessment Total Assessment is a certain percentage of the fair market value that is determined by local assessors to be the total taxable value of land and additions on the property. | Land | Improvement |
|---|---|---|---|---|
| 2025 | $6,362 | $67,310 | $13,179 | $54,131 |
| 2024 | $6,362 | $61,996 | $11,861 | $50,135 |
| 2023 | $6,416 | $61,525 | $11,861 | $49,664 |
| 2022 | $6,114 | $57,580 | $11,861 | $45,719 |
| 2021 | $5,807 | $51,969 | $10,777 | $41,192 |
| 2020 | $5,877 | $52,233 | $9,371 | $42,862 |
| 2019 | $5,999 | $52,187 | $8,142 | $44,045 |
| 2018 | $5,774 | $49,232 | $8,142 | $41,090 |
| 2017 | $5,737 | $48,047 | $8,142 | $39,905 |
| 2016 | $5,462 | $45,713 | $8,142 | $37,571 |
| 2015 | $5,220 | $43,505 | $8,142 | $35,363 |
| 2013 | -- | $41,849 | $8,142 | $33,707 |
Source: Public Records
Map
Nearby Homes
- 5012 W 163rd St
- 16224 Birch St
- 16101 Birch St
- 15921 Ash St
- 5418 W 161st Terrace
- 5324 W 160th St
- 20145 Granada St
- 20140 Granada St
- 20110 Granada St
- 20130 Granada St
- 20105 Granada St
- 20125 Granada St
- 20120 Granada St
- 5414 W 164th Place
- 4013 W 158th Place
- 4005 W 158th Place
- 4001 W 158th Place
- 3961 W 158th Place
- 3900 W 158th Place
- 5117 W 158th St
- 4949 W 162nd St
- 4941 W 162nd St
- 4937 W 162nd St
- 4933 W 162nd St
- 5100 W 162nd St
- 5103 W 161st Terrace
- 5015 W 161st Terrace
- 16201 Juniper St
- 5011 W 161st Terrace
- 5009 W 162nd St
- 5107 W 161st Terrace
- 5007 W 161st Terrace
- 5104 W 162nd St
- 16200 Juniper St
- 5008 W 163rd St
- 5108 W 162nd St
- 5003 W 161st Terrace
- 5005 W 163rd St
- 5111 W 161st Terrace
- 16205 Juniper St
Your Personal Tour Guide
Ask me questions while you tour the home.