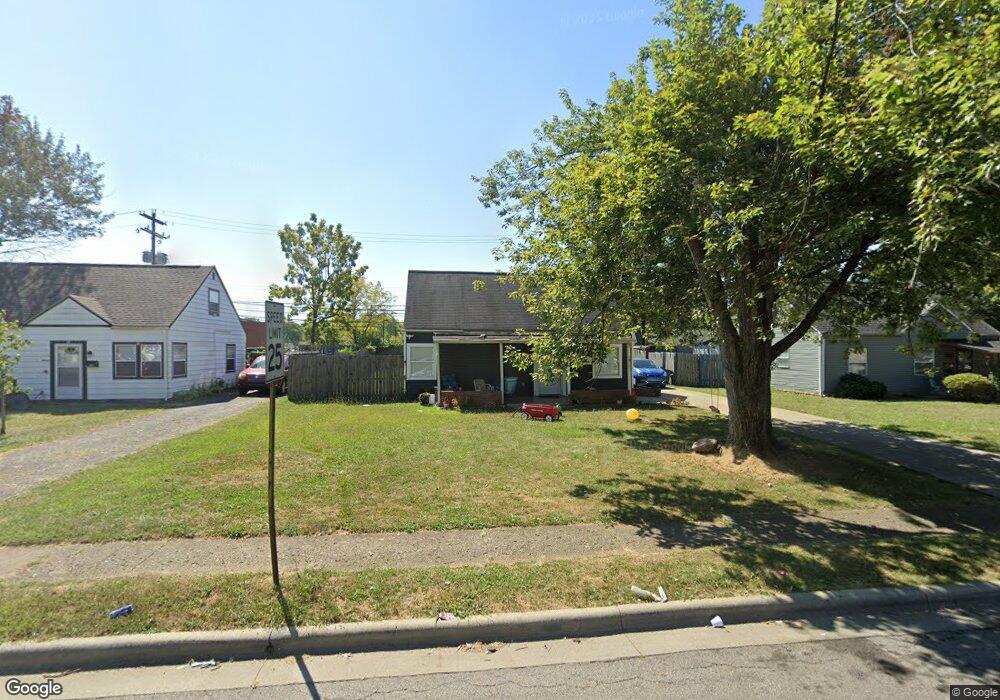
4947 Dimson Dr S Columbus, OH 43213
Estimated Value: $158,000 - $189,957
3
Beds
1
Bath
1,054
Sq Ft
$166/Sq Ft
Est. Value
About This Home
This home is located at 4947 Dimson Dr S, Columbus, OH 43213 and is currently estimated at $175,489, approximately $166 per square foot. 4947 Dimson Dr S is a home located in Franklin County with nearby schools including Etna Road Elementary School, Beechwood Elementary School, and Rosemore Middle School.
Ownership History
Date
Name
Owned For
Owner Type
Purchase Details
Closed on
May 6, 2021
Sold by
Sprague Clara J
Bought by
Martinez Barbara V and Martinez Dario E
Current Estimated Value
Purchase Details
Closed on
Nov 22, 1995
Sold by
Merriman Group Inc
Bought by
Clara J Sprague
Home Financials for this Owner
Home Financials are based on the most recent Mortgage that was taken out on this home.
Original Mortgage
$48,000
Interest Rate
8.5%
Mortgage Type
New Conventional
Purchase Details
Closed on
Sep 1, 1995
Sold by
Smith William R
Bought by
Merriman Group Inc
Home Financials for this Owner
Home Financials are based on the most recent Mortgage that was taken out on this home.
Original Mortgage
$388,000
Interest Rate
7.55%
Mortgage Type
New Conventional
Purchase Details
Closed on
Oct 28, 1988
Create a Home Valuation Report for This Property
The Home Valuation Report is an in-depth analysis detailing your home's value as well as a comparison with similar homes in the area
Home Values in the Area
Average Home Value in this Area
Purchase History
| Date | Buyer | Sale Price | Title Company |
|---|---|---|---|
| Martinez Barbara V | $50,000 | Valmer Land Title Agency Llc | |
| Clara J Sprague | $60,000 | -- | |
| Merriman Group Inc | $324,000 | -- | |
| -- | -- | -- |
Source: Public Records
Mortgage History
| Date | Status | Borrower | Loan Amount |
|---|---|---|---|
| Previous Owner | Clara J Sprague | $48,000 | |
| Previous Owner | Merriman Group Inc | $388,000 |
Source: Public Records
Tax History
| Year | Tax Paid | Tax Assessment Tax Assessment Total Assessment is a certain percentage of the fair market value that is determined by local assessors to be the total taxable value of land and additions on the property. | Land | Improvement |
|---|---|---|---|---|
| 2025 | $4,113 | $53,630 | $14,180 | $39,450 |
| 2024 | $4,113 | $53,630 | $14,180 | $39,450 |
| 2023 | $2,534 | $53,620 | $14,175 | $39,445 |
| 2022 | $1,768 | $27,650 | $6,300 | $21,350 |
| 2021 | $1,695 | $27,650 | $6,300 | $21,350 |
| 2020 | $1,657 | $27,650 | $6,300 | $21,350 |
| 2019 | $1,495 | $21,460 | $5,040 | $16,420 |
| 2018 | $1,252 | $21,460 | $5,040 | $16,420 |
| 2017 | $1,266 | $21,460 | $5,040 | $16,420 |
| 2016 | $1,123 | $17,190 | $3,780 | $13,410 |
| 2015 | $1,132 | $17,190 | $3,780 | $13,410 |
| 2014 | $1,133 | $17,190 | $3,780 | $13,410 |
| 2013 | $599 | $19,110 | $4,200 | $14,910 |
Source: Public Records
Map
Nearby Homes
- 4991 Justin Rd
- 931 Antwerp Rd
- 845 Exeter Rd
- 1260 Country Club Rd
- 1310 Manfeld Dr
- 1320 Nancy Ln
- 1211 Shady Lane Rd
- 1193 Marble Dr
- 4662 Jae Ave
- 4859 Folger Dr
- 1229 Simpson Dr
- 1243 Simpson Dr
- 547 Country Club Rd
- 1085 S Hamilton Rd
- 1472 Blaine Dr
- 1470 Efner Dr
- 706 Ross Rd
- 1284 Thurston Dr
- 1281 Maetzel Dr
- 4677 E Livingston Ave
- 4939 Dimson Dr S
- 4955 Dimson Dr S
- 4931 Dimson Dr S
- 4963 Dimson Dr S
- 4923 Dimson Dr S
- 4971 Dimson Dr S
- 4952 Dimson Dr S
- 4944 Dimson Dr S
- 4960 Dimson Dr S
- 4936 Dimson Dr S
- 5000 E Main St
- 4915 Dimson Dr S
- 4979 Dimson Dr S
- 1027 Colgate Rd
- 4928 Dimson Dr S
- 1004 Duke Rd
- 4920 Dimson Dr S
- 4987 Dimson Dr S
- 4909 Dimson Dr S
- 1015 Colgate Rd
Your Personal Tour Guide
Ask me questions while you tour the home.