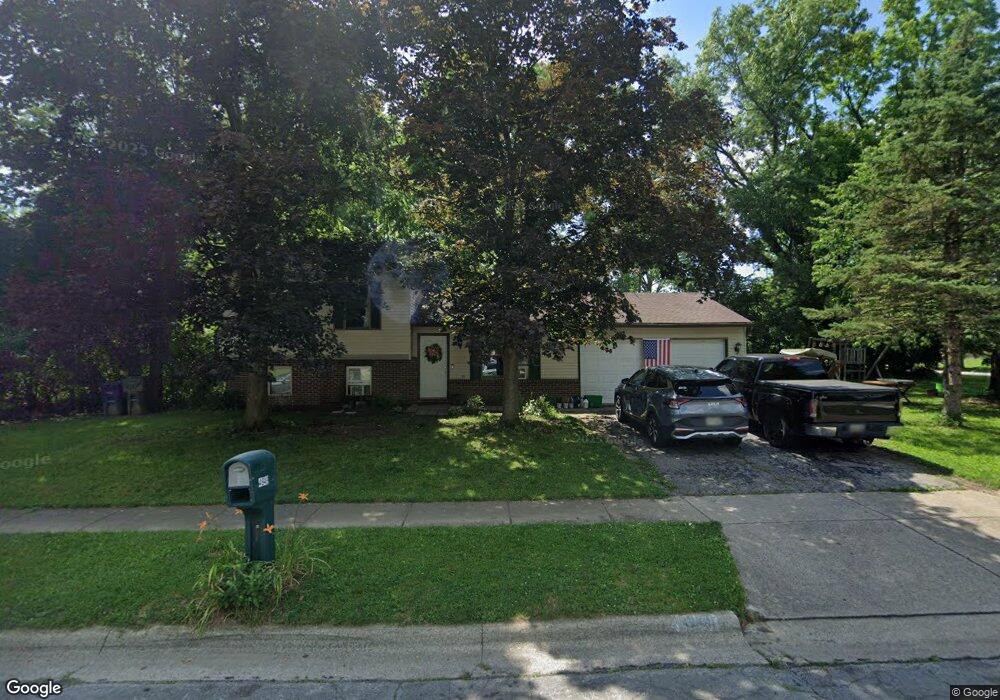
4949 Dunlap Rd Columbus, OH 43229
Forest Park East NeighborhoodEstimated Value: $211,000 - $278,000
3
Beds
3
Baths
1,148
Sq Ft
$221/Sq Ft
Est. Value
About This Home
This home is located at 4949 Dunlap Rd, Columbus, OH 43229 and is currently estimated at $253,400, approximately $220 per square foot. 4949 Dunlap Rd is a home located in Franklin County with nearby schools including Northtowne Elementary School, Woodward Park Middle School, and Northland High School.
Ownership History
Date
Name
Owned For
Owner Type
Purchase Details
Closed on
Jun 2, 2017
Sold by
Nnadi Stanley E and Nnadi Felicia N
Bought by
Neel Joseph M and Neel Linda J
Current Estimated Value
Purchase Details
Closed on
Feb 1, 2001
Sold by
Edwards Randy and Thornhill Vera
Bought by
Nnadi Felicia N and Nnadi Stanley E
Home Financials for this Owner
Home Financials are based on the most recent Mortgage that was taken out on this home.
Original Mortgage
$90,000
Outstanding Balance
$31,083
Interest Rate
7.18%
Estimated Equity
$222,317
Purchase Details
Closed on
Aug 30, 2000
Sold by
Nnadi Stanley and Nnadi Felicia
Bought by
Edwards Randy and Thornhill Vera
Home Financials for this Owner
Home Financials are based on the most recent Mortgage that was taken out on this home.
Original Mortgage
$87,000
Interest Rate
9.5%
Mortgage Type
Seller Take Back
Purchase Details
Closed on
Jan 3, 2000
Sold by
Hud
Bought by
Edwards Randy and Thornhill Vera
Purchase Details
Closed on
May 26, 1999
Sold by
David William Jr Jones and Fort Worth Mtg
Bought by
Hud
Purchase Details
Closed on
Apr 14, 1994
Bought by
Jones David W and Jones Charle
Purchase Details
Closed on
Jun 11, 1993
Purchase Details
Closed on
Apr 19, 1993
Create a Home Valuation Report for This Property
The Home Valuation Report is an in-depth analysis detailing your home's value as well as a comparison with similar homes in the area
Home Values in the Area
Average Home Value in this Area
Purchase History
| Date | Buyer | Sale Price | Title Company |
|---|---|---|---|
| Neel Joseph M | -- | None Available | |
| Nnadi Felicia N | $107,000 | -- | |
| Edwards Randy | $107,000 | -- | |
| Edwards Randy | $79,002 | -- | |
| Hud | $90,000 | -- | |
| Jones David W | $88,800 | -- | |
| -- | -- | -- | |
| -- | -- | -- |
Source: Public Records
Mortgage History
| Date | Status | Borrower | Loan Amount |
|---|---|---|---|
| Open | Nnadi Felicia N | $90,000 | |
| Closed | Edwards Randy | $87,000 | |
| Closed | Neel Joseph M | $0 |
Source: Public Records
Tax History
| Year | Tax Paid | Tax Assessment Tax Assessment Total Assessment is a certain percentage of the fair market value that is determined by local assessors to be the total taxable value of land and additions on the property. | Land | Improvement |
|---|---|---|---|---|
| 2025 | $3,179 | $69,370 | $25,270 | $44,100 |
| 2024 | $3,179 | $69,370 | $25,270 | $44,100 |
| 2023 | $3,139 | $69,370 | $25,270 | $44,100 |
| 2022 | $2,349 | $44,210 | $17,610 | $26,600 |
| 2021 | $2,354 | $44,210 | $17,610 | $26,600 |
| 2020 | $2,357 | $44,210 | $17,610 | $26,600 |
| 2019 | $2,198 | $35,350 | $14,070 | $21,280 |
| 2018 | $2,138 | $35,350 | $14,070 | $21,280 |
| 2017 | $2,483 | $39,940 | $14,070 | $25,870 |
| 2016 | $2,285 | $33,640 | $10,570 | $23,070 |
| 2015 | $2,081 | $33,640 | $10,570 | $23,070 |
| 2014 | $2,086 | $33,640 | $10,570 | $23,070 |
| 2013 | $1,083 | $35,420 | $11,130 | $24,290 |
Source: Public Records
Map
Nearby Homes
- 1905 Denise Dr
- 4885 Northtowne Blvd
- 4979 Lyle Rd
- 4857 Tamarack Blvd
- 4852 Snowbird Cir Unit 13B
- 1685 Norma Rd
- 2177 Margo Rd
- 2251 Tuliptree Ave
- 4923 Karl Rd Unit 4925
- 4909-4911 Karl Rd
- 5010 Julie Place
- 5004 Julie Place
- 1638 Arrowood Loop N
- 1485 Norma Rd
- 2087 Teakwood Dr
- 1862 Torchwood Dr
- 4795 Colonel Perry Dr
- 5352 Hazelwood Rd
- 5486 Pine Bluff Rd
- 2294 Teakwood Dr
- 1941 Denise Dr
- 1944 Judwick Dr
- 1933 Denise Dr
- 1966 Denise Dr
- 4944 Dunlap Rd
- 4950 Dunlap Rd
- 1960 Denise Dr
- 1960 Denise Dr Unit L43
- 4938 Dunlap Rd
- 1936 Judwick Dr
- 0 Denise Dr
- 1923 Denise Dr
- 1928 Judwick Dr
- 1948 Denise Dr
- 1940 Denise Dr
- 4922 Dunlap Rd
- 1920 Judwick Dr
- 1932 Denise Dr
- 1915 Denise Dr
- 4945 Brittany Ct W
Your Personal Tour Guide
Ask me questions while you tour the home.