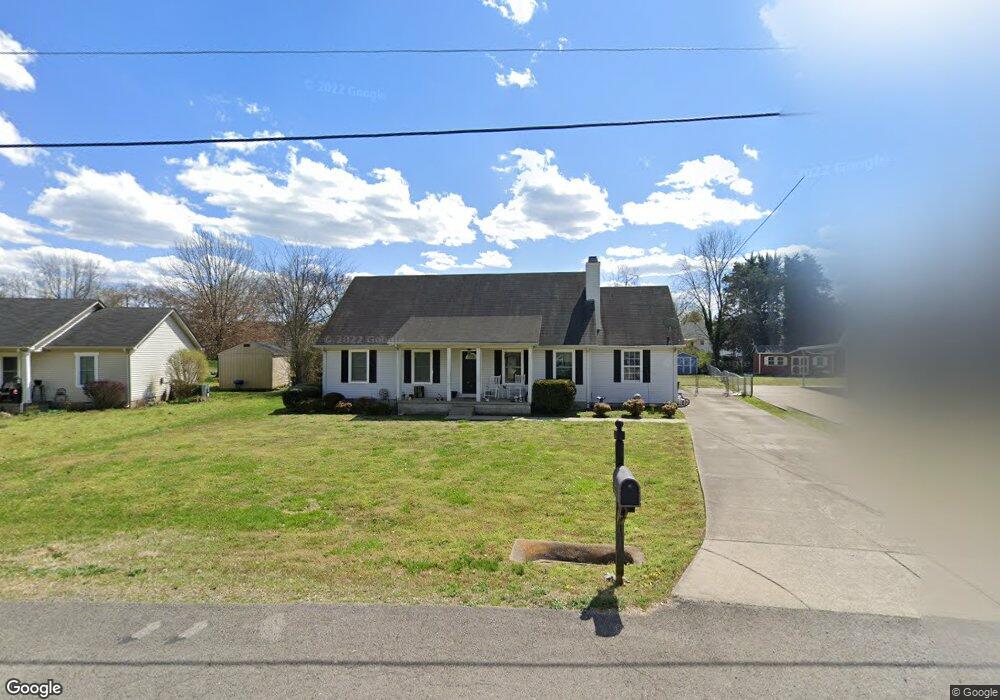
4949 E Calgary Murfreesboro, TN 37129
Estimated Value: $412,000 - $492,000
Studio
3
Baths
2,161
Sq Ft
$205/Sq Ft
Est. Value
About This Home
This home is located at 4949 E Calgary, Murfreesboro, TN 37129 and is currently estimated at $442,319, approximately $204 per square foot. 4949 E Calgary is a home located in Rutherford County with nearby schools including Brown's Chapel Elementary School, Stewarts Creek Middle School, and Stewarts Creek High School.
Ownership History
Date
Name
Owned For
Owner Type
Purchase Details
Closed on
Oct 13, 2022
Sold by
Ward Christopher and Ward Pamela
Bought by
Ward Christopher and Ward Pamela
Current Estimated Value
Home Financials for this Owner
Home Financials are based on the most recent Mortgage that was taken out on this home.
Original Mortgage
$246,592
Outstanding Balance
$237,044
Interest Rate
5.89%
Mortgage Type
VA
Estimated Equity
$205,275
Purchase Details
Closed on
Mar 8, 2013
Sold by
Odom Gregory W
Bought by
Ward Christopher and Frey Pamela
Home Financials for this Owner
Home Financials are based on the most recent Mortgage that was taken out on this home.
Original Mortgage
$165,938
Interest Rate
4.2%
Mortgage Type
FHA
Purchase Details
Closed on
Aug 29, 2012
Sold by
Thda
Bought by
Odom Gregory W
Purchase Details
Closed on
Mar 23, 2012
Sold by
Emmett Tracy Lynn
Bought by
Thda
Purchase Details
Closed on
Dec 10, 2008
Sold by
Emmett Nicky Lamar
Bought by
Emmett Tracy Lynn
Purchase Details
Closed on
Aug 19, 2004
Sold by
Ole South Properties Inc
Bought by
Jason Bohannon
Purchase Details
Closed on
Jan 27, 1999
Sold by
Dewey Smith
Bought by
Smith Dewey R
Create a Home Valuation Report for This Property
The Home Valuation Report is an in-depth analysis detailing your home's value as well as a comparison with similar homes in the area
Home Values in the Area
Average Home Value in this Area
Purchase History
| Date | Buyer | Sale Price | Title Company |
|---|---|---|---|
| Ward Christopher | -- | -- | |
| Ward Christopher | $169,000 | -- | |
| Odom Gregory W | $88,150 | -- | |
| Thda | $115,123 | -- | |
| Emmett Tracy Lynn | -- | -- | |
| Jason Bohannon | $132,940 | -- | |
| Smith Dewey R | -- | -- |
Source: Public Records
Mortgage History
| Date | Status | Borrower | Loan Amount |
|---|---|---|---|
| Open | Ward Christopher | $246,592 | |
| Previous Owner | Ward Christopher | $165,938 |
Source: Public Records
Tax History
| Year | Tax Paid | Tax Assessment Tax Assessment Total Assessment is a certain percentage of the fair market value that is determined by local assessors to be the total taxable value of land and additions on the property. | Land | Improvement |
|---|---|---|---|---|
| 2025 | $1,522 | $81,125 | $13,750 | $67,375 |
| 2024 | -- | $81,125 | $13,750 | $67,375 |
| 2023 | $1,522 | $81,125 | $13,750 | $67,375 |
| 2022 | $1,313 | $81,250 | $13,750 | $67,500 |
| 2021 | $1,348 | $60,750 | $8,750 | $52,000 |
| 2020 | $1,348 | $60,750 | $8,750 | $52,000 |
| 2019 | $1,348 | $60,750 | $8,750 | $52,000 |
| 2018 | $1,275 | $60,750 | $0 | $0 |
| 2017 | $1,129 | $42,125 | $0 | $0 |
| 2016 | $1,129 | $42,125 | $0 | $0 |
| 2015 | $1,129 | $42,125 | $0 | $0 |
| 2014 | $1,048 | $42,125 | $0 | $0 |
| 2013 | -- | $38,025 | $0 | $0 |
Source: Public Records
Map
Nearby Homes
- 4955 E Calgary
- 4943 E Calgary
- 120 Bedford Ct
- 5001 E Calgary
- 4927 E Calgary
- 4940 E Calgary
- 123 Bedford Ct
- 5007 E Calgary
- 113 Worchester Ct
- 4956 E Calgary
- 116 Bedford Ct
- 4921 E Calgary
- 4916 E Calgary
- 119 Bedford Ct
- 5002 E Calgary
- 5013 E Calgary
- 4915 E Calgary
- 4910 E Calgary
- 115 Bedford Ct
- 5008 E Calgary
Your Personal Tour Guide
Ask me questions while you tour the home.