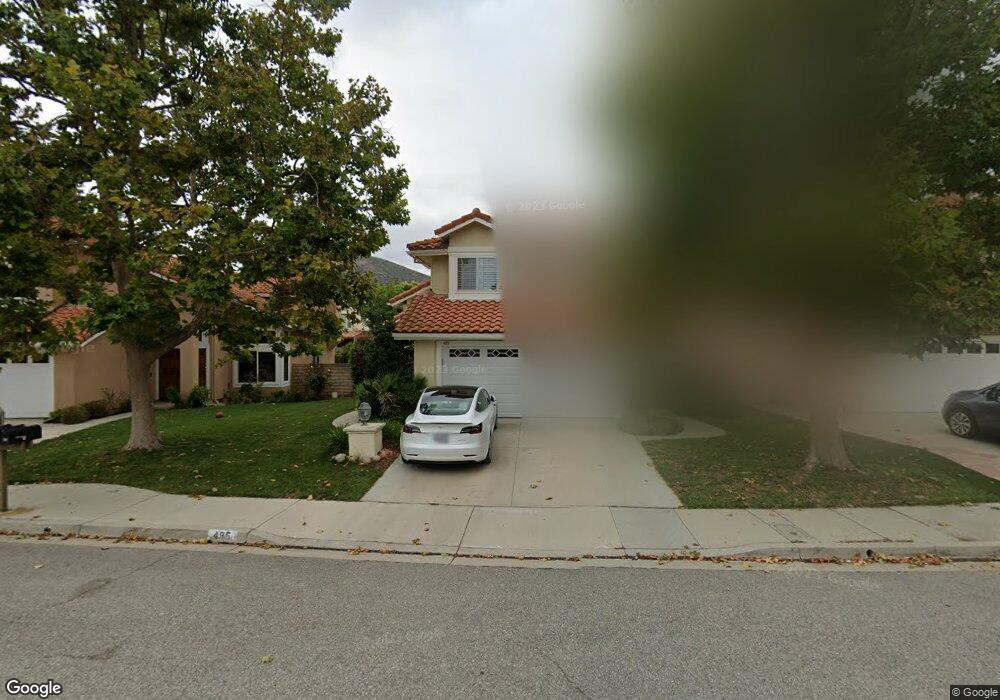
495 Bernini Ct Oak Park, CA 91377
Estimated Value: $1,256,866 - $1,330,000
3
Beds
3
Baths
1,970
Sq Ft
$662/Sq Ft
Est. Value
About This Home
This home is located at 495 Bernini Ct, Oak Park, CA 91377 and is currently estimated at $1,303,467, approximately $661 per square foot. 495 Bernini Ct is a home located in Ventura County with nearby schools including Medea Creek Middle School and Oak Park High School.
Ownership History
Date
Name
Owned For
Owner Type
Purchase Details
Closed on
Mar 16, 2019
Sold by
Marcos Julio and Marcos Hannah D
Bought by
Marcos Julio and Marcos Hannah D
Current Estimated Value
Purchase Details
Closed on
Aug 12, 2009
Sold by
Deam Christopher R and Deam Silvana
Bought by
Marcos Julio and Marcos Hannah D
Home Financials for this Owner
Home Financials are based on the most recent Mortgage that was taken out on this home.
Original Mortgage
$520,000
Outstanding Balance
$338,350
Interest Rate
5.17%
Mortgage Type
Purchase Money Mortgage
Estimated Equity
$965,117
Purchase Details
Closed on
Apr 6, 2005
Sold by
Arneson Edwin H and Arneson Carolyn
Bought by
Deam Christopher R and Deam Silvana
Home Financials for this Owner
Home Financials are based on the most recent Mortgage that was taken out on this home.
Original Mortgage
$628,000
Interest Rate
5.92%
Mortgage Type
Fannie Mae Freddie Mac
Purchase Details
Closed on
Jul 3, 2003
Sold by
Arneson Edwin H and Arneson Carolyn M
Bought by
Arneson Edwin H and Arneson Carolyn
Home Financials for this Owner
Home Financials are based on the most recent Mortgage that was taken out on this home.
Original Mortgage
$312,000
Interest Rate
5.22%
Mortgage Type
Purchase Money Mortgage
Purchase Details
Closed on
Dec 18, 2002
Sold by
Arneson Edwin H and Arneson Carolyn M
Bought by
Arneson Edwin H and Arneson Carolyn M
Home Financials for this Owner
Home Financials are based on the most recent Mortgage that was taken out on this home.
Original Mortgage
$300,700
Interest Rate
6.28%
Purchase Details
Closed on
Nov 21, 2002
Sold by
Arneson Edwin H and Arneson Carolyn M
Bought by
Arneson Edwin H and Arneson Carolyn M
Home Financials for this Owner
Home Financials are based on the most recent Mortgage that was taken out on this home.
Original Mortgage
$300,700
Interest Rate
6.28%
Purchase Details
Closed on
Aug 9, 2002
Sold by
Arneson Edwin H and Arneson Carolyn
Bought by
Arneson Edwin H and Arneson Carolyn M
Purchase Details
Closed on
Feb 5, 2002
Sold by
Westin Marjory Y
Bought by
Arneson Edwin H and Arneson Carolyn
Home Financials for this Owner
Home Financials are based on the most recent Mortgage that was taken out on this home.
Original Mortgage
$284,000
Interest Rate
6.12%
Purchase Details
Closed on
Jun 11, 2001
Sold by
Westin Marjory Y
Bought by
Westin Marjory Y
Purchase Details
Closed on
Sep 15, 1997
Sold by
Westin Carl O and Westin Marjory Y
Bought by
Westin Carl O
Create a Home Valuation Report for This Property
The Home Valuation Report is an in-depth analysis detailing your home's value as well as a comparison with similar homes in the area
Home Values in the Area
Average Home Value in this Area
Purchase History
| Date | Buyer | Sale Price | Title Company |
|---|---|---|---|
| Marcos Julio | -- | None Available | |
| Marcos Julio | $650,000 | Chicago Title Company | |
| Deam Christopher R | $786,818 | Southland Title | |
| Arneson Edwin H | -- | Old Republic Title Company | |
| Arneson Edwin H | -- | Old Republic Title Company | |
| Arneson Edwin H | -- | -- | |
| Arneson Edwin H | -- | American Title Co | |
| Arneson Edwin H | -- | -- | |
| Arneson Edwin H | $355,000 | Fidelity National Title | |
| Westin Marjory Y | -- | -- | |
| Westin Marjory Y | -- | -- | |
| Westin Carl O | -- | -- |
Source: Public Records
Mortgage History
| Date | Status | Borrower | Loan Amount |
|---|---|---|---|
| Open | Marcos Julio | $520,000 | |
| Previous Owner | Deam Christopher R | $628,000 | |
| Previous Owner | Arneson Edwin H | $312,000 | |
| Previous Owner | Arneson Edwin H | $300,700 | |
| Previous Owner | Arneson Edwin H | $284,000 | |
| Closed | Deam Christopher R | $78,500 |
Source: Public Records
Tax History
| Year | Tax Paid | Tax Assessment Tax Assessment Total Assessment is a certain percentage of the fair market value that is determined by local assessors to be the total taxable value of land and additions on the property. | Land | Improvement |
|---|---|---|---|---|
| 2025 | $10,889 | $839,017 | $419,509 | $419,508 |
| 2024 | $10,889 | $822,566 | $411,283 | $411,283 |
| 2023 | $10,816 | $806,438 | $403,219 | $403,219 |
| 2022 | $10,351 | $790,626 | $395,313 | $395,313 |
| 2021 | $9,999 | $775,124 | $387,562 | $387,562 |
| 2020 | $9,883 | $767,178 | $383,589 | $383,589 |
| 2019 | $9,476 | $752,136 | $376,068 | $376,068 |
| 2018 | $9,252 | $737,390 | $368,695 | $368,695 |
| 2017 | $9,037 | $722,932 | $361,466 | $361,466 |
| 2016 | $8,899 | $708,758 | $354,379 | $354,379 |
| 2015 | $8,973 | $698,114 | $349,057 | $349,057 |
| 2014 | $8,808 | $684,440 | $342,220 | $342,220 |
Source: Public Records
Map
Nearby Homes
- 4790 Gondola Dr
- 5711 Tanner Ridge Ave
- 4933 Santo Dr
- 4827 Matteo St
- 843 Sunstone St
- 841 Sunstone St Unit 43
- 815 Sunstone St
- 5614 Roundtree Place
- 5602 Roundtree Place
- 830 Pleasant Dale Place
- 5567 Spring Hill Ct
- 776 Sunfield Ct
- 5566 Spring Hill Ct
- 219 Ocho Rios Way
- 5118 Churchwood Dr
- 445 Cremona Way
- 754 Bellagio Ct
- 4744 Rhapsody Dr
- 133 Concerto Dr
- 4900 Kilburn Ct
- 499 Bernini Ct
- 491 Bernini Ct
- 494 Messina Place
- 498 Messina Place
- 490 Messina Place
- 486 Messina Place
- 487 Bernini Ct
- 4834 Wiggin St
- 482 Messina Place
- 483 Bernini Ct
- 4819 Wiggin St
- 479 Bernini Ct
- 4811 Wiggin St
- 4842 Wiggin St
- 4827 Wiggin St
- 4803 Wiggin St
- 4835 Wiggin St
- 4811 Parma Dr
- 4815 Parma Dr
- 4819 Parma Dr Unit 10
Your Personal Tour Guide
Ask me questions while you tour the home.