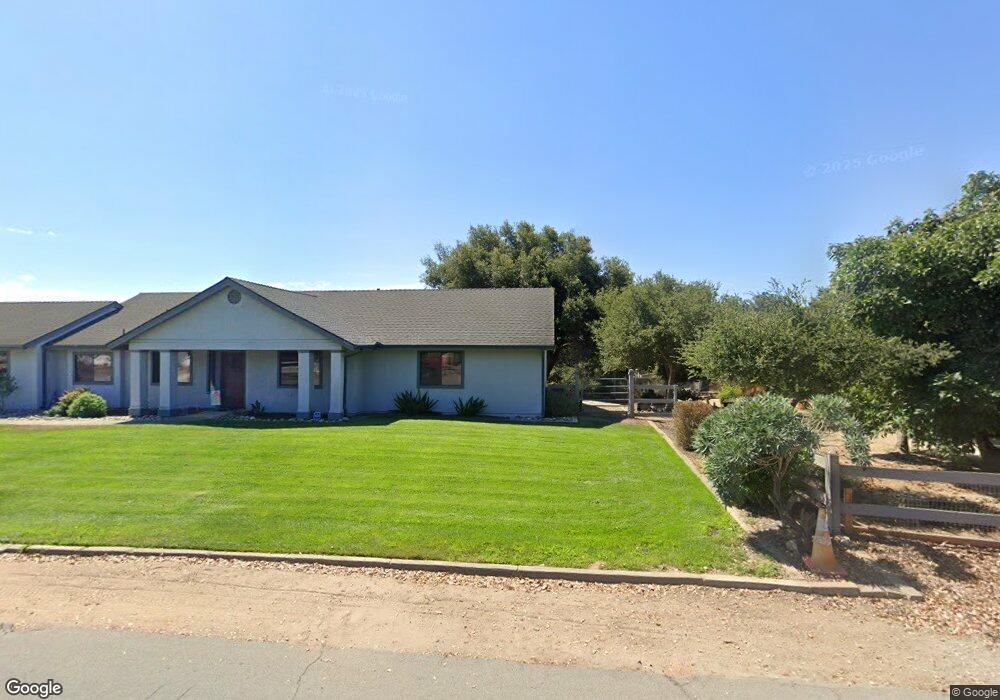
495 Lantana St Nipomo, CA 93444
Estimated Value: $976,000 - $1,030,000
3
Beds
2
Baths
1,703
Sq Ft
$584/Sq Ft
Est. Value
About This Home
This home is located at 495 Lantana St, Nipomo, CA 93444 and is currently estimated at $995,122, approximately $584 per square foot. 495 Lantana St is a home located in San Luis Obispo County with nearby schools including Dana Elementary School, Mesa Middle School, and Nipomo High School.
Ownership History
Date
Name
Owned For
Owner Type
Purchase Details
Closed on
Nov 21, 2011
Sold by
Planinac John W and Planinac Jerri L
Bought by
Planinac John William and Planinac Jerri Lynn
Current Estimated Value
Purchase Details
Closed on
Feb 12, 2008
Sold by
Planinac John W and Planinac Jerri L
Bought by
Planinac John William and Planinac Jerri Lynn
Create a Home Valuation Report for This Property
The Home Valuation Report is an in-depth analysis detailing your home's value as well as a comparison with similar homes in the area
Home Values in the Area
Average Home Value in this Area
Purchase History
| Date | Buyer | Sale Price | Title Company |
|---|---|---|---|
| Planinac John William | -- | Accommodation | |
| Planinac John W | -- | Accommodation | |
| Planinac John William | -- | None Available |
Source: Public Records
Tax History Compared to Growth
Tax History
| Year | Tax Paid | Tax Assessment Tax Assessment Total Assessment is a certain percentage of the fair market value that is determined by local assessors to be the total taxable value of land and additions on the property. | Land | Improvement |
|---|---|---|---|---|
| 2025 | $3,558 | $353,040 | $131,339 | $221,701 |
| 2024 | $3,516 | $346,118 | $128,764 | $217,354 |
| 2023 | $3,516 | $339,333 | $126,240 | $213,093 |
| 2022 | $3,461 | $332,680 | $123,765 | $208,915 |
| 2021 | $3,453 | $326,158 | $121,339 | $204,819 |
| 2020 | $3,413 | $322,814 | $120,095 | $202,719 |
| 2019 | $3,391 | $316,486 | $117,741 | $198,745 |
| 2018 | $3,349 | $310,282 | $115,433 | $194,849 |
| 2017 | $3,285 | $304,199 | $113,170 | $191,029 |
| 2016 | $3,096 | $298,235 | $110,951 | $187,284 |
| 2015 | $3,051 | $293,756 | $109,285 | $184,471 |
| 2014 | $2,936 | $288,003 | $107,145 | $180,858 |
Source: Public Records
Map
Nearby Homes
- 7855 Suey Creek Rd
- 615 Sweet Donna Place
- 620 Camino Roble
- 261 Hazel Ln
- 161 Lot Scenic View Way
- 0 Scenic View Way
- 1431 La Loma Dr
- 1685 Scenic View Way
- 393 Uranus Ct
- 1180 Starlite Dr
- 585 Via Mira Valle
- 1127 Starlite Dr
- 875 Camino Caballo
- 219 Lema Dr
- 426 Polaris Dr
- 1010 1012 Upper Los Berros Rd
- 457 Polaris Dr
- 217 Hope Way
- 945 Jeanette Ln
- 759 Viola Ct