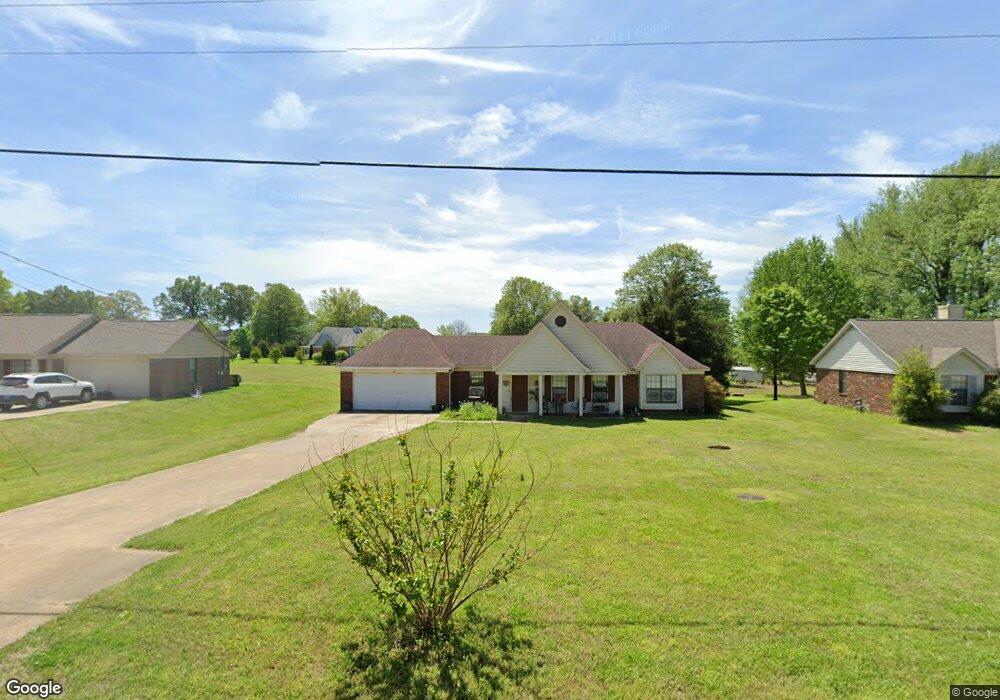
495 Mebane Rd Oakland, TN 38060
Estimated Value: $224,000 - $255,000
3
Beds
2
Baths
1,256
Sq Ft
$189/Sq Ft
Est. Value
About This Home
This home is located at 495 Mebane Rd, Oakland, TN 38060 and is currently estimated at $237,623, approximately $189 per square foot. 495 Mebane Rd is a home located in Fayette County with nearby schools including Oakland Elementary School, West Junior High School, and Fayette Ware Comprehensive High School.
Ownership History
Date
Name
Owned For
Owner Type
Purchase Details
Closed on
Jul 31, 2009
Sold by
Wells Fargo Bank Na
Bought by
Robertson David L
Current Estimated Value
Home Financials for this Owner
Home Financials are based on the most recent Mortgage that was taken out on this home.
Original Mortgage
$103,098
Outstanding Balance
$66,877
Interest Rate
5.11%
Mortgage Type
FHA
Estimated Equity
$170,746
Purchase Details
Closed on
May 22, 2009
Sold by
Hurst J D
Bought by
Wells Fargo Bank Na
Purchase Details
Closed on
Mar 12, 2007
Sold by
Burton Place Llc
Bought by
Krahl Jimmy D
Purchase Details
Closed on
Mar 7, 1997
Sold by
Worsham Maryam Bahrami
Bought by
Ham William P and Ham Pamela
Purchase Details
Closed on
Jan 10, 1994
Bought by
Worsham Stanley K and Maryam Bahrami
Purchase Details
Closed on
Mar 12, 1993
Bought by
Morrow Jim
Purchase Details
Closed on
Jan 6, 1992
Bought by
Porter & Street
Create a Home Valuation Report for This Property
The Home Valuation Report is an in-depth analysis detailing your home's value as well as a comparison with similar homes in the area
Home Values in the Area
Average Home Value in this Area
Purchase History
| Date | Buyer | Sale Price | Title Company |
|---|---|---|---|
| Robertson David L | $105,000 | -- | |
| Robertson David L | $105,000 | -- | |
| Wells Fargo Bank Na | $107,173 | -- | |
| Wells Fargo Bank Na Trustee | $107,173 | -- | |
| Krahl Jimmy D | $495,000 | -- | |
| Ham William P | $89,000 | -- | |
| Worsham Stanley K | $77,900 | -- | |
| Morrow Jim | $15,500 | -- | |
| Porter & Street | -- | -- |
Source: Public Records
Mortgage History
| Date | Status | Borrower | Loan Amount |
|---|---|---|---|
| Open | Robertson David L | $103,098 |
Source: Public Records
Tax History Compared to Growth
Tax History
| Year | Tax Paid | Tax Assessment Tax Assessment Total Assessment is a certain percentage of the fair market value that is determined by local assessors to be the total taxable value of land and additions on the property. | Land | Improvement |
|---|---|---|---|---|
| 2024 | $480 | $37,900 | $10,000 | $27,900 |
| 2023 | $978 | $37,900 | $0 | $0 |
| 2022 | $649 | $37,900 | $10,000 | $27,900 |
| 2021 | $649 | $37,900 | $10,000 | $27,900 |
| 2020 | $471 | $37,900 | $10,000 | $27,900 |
| 2019 | $634 | $31,275 | $8,750 | $22,525 |
| 2018 | $652 | $31,275 | $8,750 | $22,525 |
| 2017 | $556 | $31,275 | $8,750 | $22,525 |
| 2016 | $562 | $29,525 | $8,750 | $20,775 |
| 2015 | $562 | $29,525 | $8,750 | $20,775 |
| 2014 | $562 | $29,525 | $8,750 | $20,775 |
Source: Public Records
Map
Nearby Homes
- 50 Sheraton Cove
- 175 Marrietta Dr
- 75 Brookwood Cir
- 430 Marrietta Dr
- 130 Valleyview Ln
- 155 Countryside Dr
- 50 Sugalina Valley Dr
- 260 Country Brook Dr
- 245 Cherokee Cir
- 225 Country Brook Dr
- 60 Sugalina Valley Dr
- Asher Plan at Valleybrook
- Belmont Plan at Valleybrook
- Presley II Plan at Valleybrook
- Carson Plan at Valleybrook
- Carlisle Plan at Valleybrook
- Delaney Plan at Valleybrook
- Conway Plan at Valleybrook
- 30 Betsy Valley Dr
- 175 Valleyview Ln
- 475 Mebane Rd
- 515 Mebane Rd
- 535 Mebane Rd
- 490 Mebane Rd
- 15 Austin Dr
- 445 Mebane Rd
- 510 Mebane Rd
- 80 Countrywood Ln
- 45 Countrywood Ln
- 530 Mebane Rd
- 25 Burton Place Dr
- 90 Countrywood Ln
- 25 Austin Cir
- 10 Austin Dr
- 425 Mebane Rd
- 45 Burton Place Dr
- 35 Austin Cir
- 65 Burton Place Dr
- 15 Austin Cir
- 35 Country Place