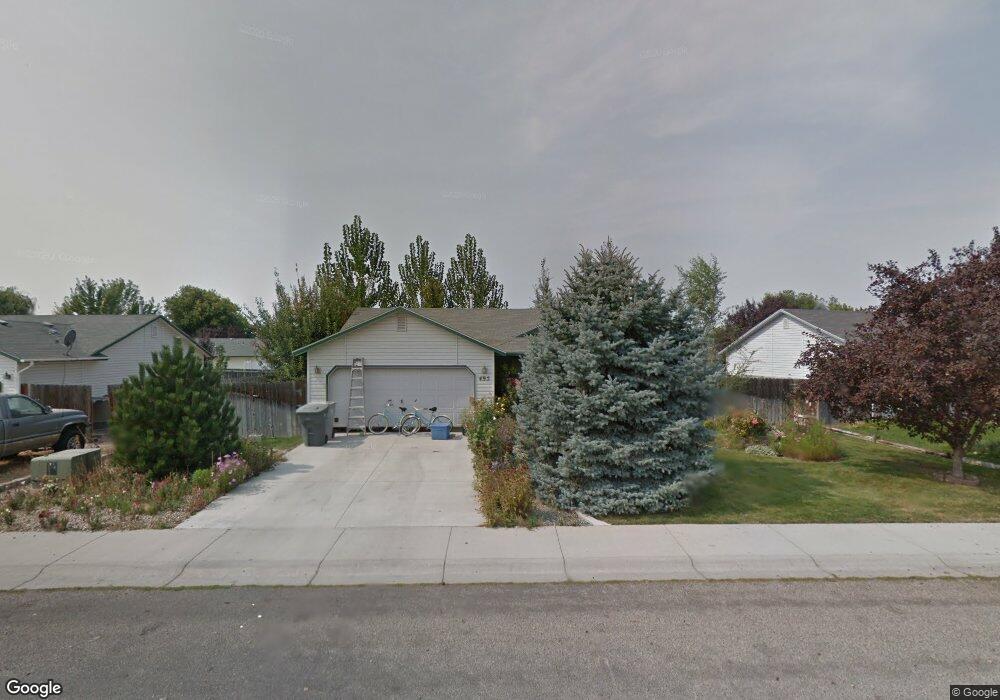
495 Mountain Loop St Middleton, ID 83644
Estimated Value: $340,000 - $366,000
3
Beds
2
Baths
1,176
Sq Ft
$296/Sq Ft
Est. Value
About This Home
This home is located at 495 Mountain Loop St, Middleton, ID 83644 and is currently estimated at $348,383, approximately $296 per square foot. 495 Mountain Loop St is a home located in Canyon County with nearby schools including Middleton Mill Creek Elementary School, Middleton Middle School, and Middleton High School.
Ownership History
Date
Name
Owned For
Owner Type
Purchase Details
Closed on
Jul 15, 2021
Sold by
Duffy Tharesa M and Mueller Sharon M
Bought by
Mueller Sharon M and Waggor Tharesa M
Current Estimated Value
Purchase Details
Closed on
Jan 24, 2011
Sold by
Duffy Theresa Marie
Bought by
Duffy Theresa Marie and Mueller Sharon M
Purchase Details
Closed on
Apr 29, 2009
Sold by
Scott Michael W and Duffy Theresa M
Bought by
Duffy Theresa M
Home Financials for this Owner
Home Financials are based on the most recent Mortgage that was taken out on this home.
Original Mortgage
$59,500
Interest Rate
4.99%
Mortgage Type
Stand Alone Refi Refinance Of Original Loan
Purchase Details
Closed on
Apr 27, 2005
Sold by
Sotelo Juventino S and Sotelo Hilda
Bought by
Scott Michael W and Scott Theresa M
Home Financials for this Owner
Home Financials are based on the most recent Mortgage that was taken out on this home.
Original Mortgage
$59,500
Interest Rate
5.92%
Mortgage Type
Fannie Mae Freddie Mac
Create a Home Valuation Report for This Property
The Home Valuation Report is an in-depth analysis detailing your home's value as well as a comparison with similar homes in the area
Home Values in the Area
Average Home Value in this Area
Purchase History
| Date | Buyer | Sale Price | Title Company |
|---|---|---|---|
| Mueller Sharon M | -- | None Listed On Document | |
| Duffy Theresa Marie | -- | None Available | |
| Duffy Theresa M | -- | Pioneer Title Company | |
| Scott Michael W | -- | -- |
Source: Public Records
Mortgage History
| Date | Status | Borrower | Loan Amount |
|---|---|---|---|
| Previous Owner | Duffy Theresa M | $59,500 | |
| Previous Owner | Scott Michael W | $59,500 |
Source: Public Records
Tax History
| Year | Tax Paid | Tax Assessment Tax Assessment Total Assessment is a certain percentage of the fair market value that is determined by local assessors to be the total taxable value of land and additions on the property. | Land | Improvement |
|---|---|---|---|---|
| 2025 | $2,031 | $311,700 | $108,000 | $203,700 |
| 2024 | $2,031 | $305,400 | $96,000 | $209,400 |
| 2023 | $2,116 | $307,000 | $96,000 | $211,000 |
| 2022 | $1,383 | $329,200 | $108,000 | $221,200 |
| 2021 | $630 | $227,000 | $50,500 | $176,500 |
| 2020 | $679 | $194,000 | $39,000 | $155,000 |
| 2019 | $682 | $171,700 | $33,500 | $138,200 |
| 2018 | $681 | $0 | $0 | $0 |
| 2017 | $633 | $0 | $0 | $0 |
| 2016 | $613 | $0 | $0 | $0 |
| 2015 | $548 | $0 | $0 | $0 |
| 2014 | $502 | $103,000 | $19,500 | $83,500 |
Source: Public Records
Map
Nearby Homes
- 634 Mountain Loop St
- 533 W Millstone St
- 495 W Millstone St
- 544 W Millstone St
- 616 W Millstone St
- 474 W Millstone St
- 438 W Millstone St
- 485 Hidden Mill Ct
- 461 Hidden Mill Ct
- 428 Hidden Mill Ct
- 400 Hidden Mill Ct
- 430 W Millstone St
- 52 Cobblestone Ct
- 650 Triumph Dr
- 402 W Flour Mill Ct
- 628 Kennedy Dr
- 6 Canyon Dr
- 7 Brice Ave W
- 406 Duke Ave
- 1071 Valley Ct
- 495 Peak Ave
- 511 Peak Ave
- 511 Mountain Loop St
- 481 Mountain Loop St
- 593 Meadow Ct
- 533 Peak Ave
- 586 Meadow Ct
- 533 Mountain Loop St
- 469 Mountain Loop St
- 490 Mountain Loop St
- 508 Peak Ave
- 508 Mountain Loop St
- 472 Mountain Loop St
- 520 Mountain Loop St
- 5769 S Partridge Peak
- 599 Valley St
- 583 Valley St
- 579 Meadow Ct
- 615 Valley St
- 562 Meadow Ct
Your Personal Tour Guide
Ask me questions while you tour the home.