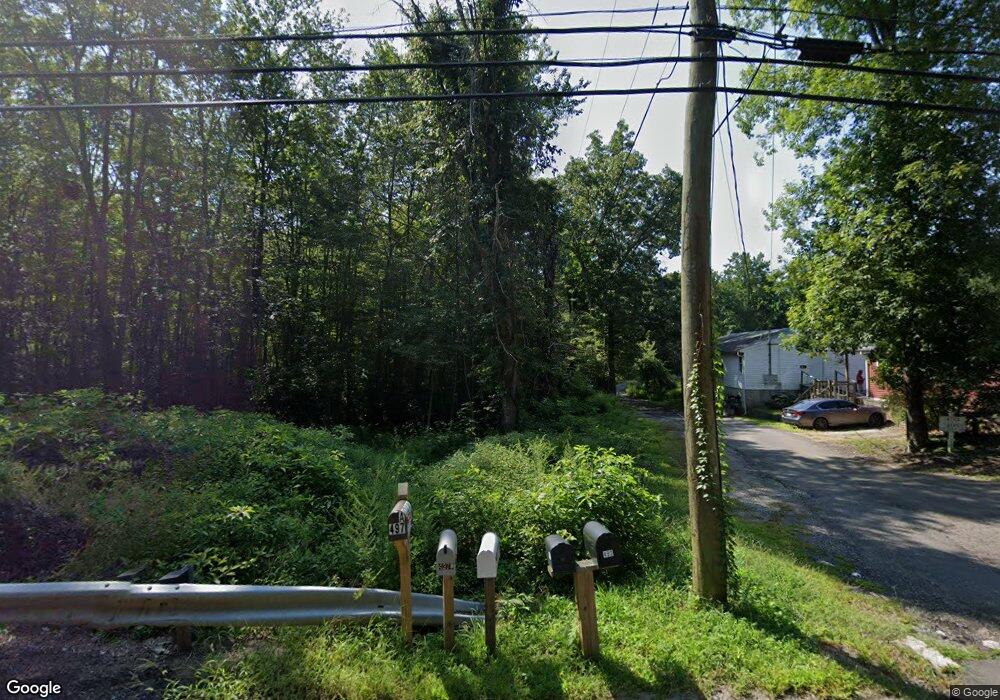
495 Winthrop Rd Deep River, CT 06417
Estimated Value: $488,285 - $756,000
4
Beds
3
Baths
2,288
Sq Ft
$257/Sq Ft
Est. Value
About This Home
This home is located at 495 Winthrop Rd, Deep River, CT 06417 and is currently estimated at $589,071, approximately $257 per square foot. 495 Winthrop Rd is a home located in Middlesex County with nearby schools including Valley Regional High School.
Ownership History
Date
Name
Owned For
Owner Type
Purchase Details
Closed on
Jan 31, 2018
Sold by
Tomlinson Michael H and Tomlinson James A
Bought by
Tomlinson James A
Current Estimated Value
Purchase Details
Closed on
Aug 11, 2009
Sold by
Tomlinson Jennie
Bought by
Tomlinson Michael and Tomlinson James
Create a Home Valuation Report for This Property
The Home Valuation Report is an in-depth analysis detailing your home's value as well as a comparison with similar homes in the area
Home Values in the Area
Average Home Value in this Area
Purchase History
| Date | Buyer | Sale Price | Title Company |
|---|---|---|---|
| Tomlinson James A | -- | -- | |
| Tomlinson James A | -- | -- | |
| Tomlinson Michael | -- | -- | |
| Tomlinson Jennie | -- | -- |
Source: Public Records
Mortgage History
| Date | Status | Borrower | Loan Amount |
|---|---|---|---|
| Previous Owner | Tomlinson Jennie | $200,000 | |
| Previous Owner | Tomlinson Jennie | $156,000 | |
| Previous Owner | Tomlinson Jennie | $150,000 |
Source: Public Records
Tax History
| Year | Tax Paid | Tax Assessment Tax Assessment Total Assessment is a certain percentage of the fair market value that is determined by local assessors to be the total taxable value of land and additions on the property. | Land | Improvement |
|---|---|---|---|---|
| 2025 | $8,710 | $272,370 | $121,450 | $150,920 |
| 2024 | $8,547 | $272,370 | $121,450 | $150,920 |
| 2023 | $8,138 | $272,370 | $121,450 | $150,920 |
| 2022 | $7,893 | $272,370 | $121,450 | $150,920 |
| 2021 | $8,057 | $272,370 | $121,450 | $150,920 |
| 2020 | $7,927 | $264,320 | $134,190 | $130,130 |
| 2019 | $7,776 | $264,320 | $134,190 | $130,130 |
| 2018 | $7,776 | $264,320 | $134,190 | $130,130 |
| 2017 | $7,644 | $264,320 | $134,190 | $130,130 |
| 2016 | $7,277 | $264,320 | $134,190 | $130,130 |
| 2015 | $8,151 | $310,170 | $155,890 | $154,280 |
| 2014 | $8,027 | $310,170 | $155,890 | $154,280 |
Source: Public Records
Map
Nearby Homes
- 538 Winthrop Rd
- 0 Glen Grove Rd
- 112 Cedar Swamp Rd
- 272 Westbrook Rd
- 97 Bushy Hill Rd
- 151 Bushy Hill Rd
- 113 Winthrop Rd
- 41 Bushy Hill Rd
- 22 Ebony Ln
- 8 Butter Jones Rd
- 120 Warsaw St
- 279 Roast Meat Hill Rd
- 214 Kelsey Hill Rd
- 50 Kelseytown Rd
- 48A Ironworks Rd
- 29 Mitchel Terrace
- 4 Laurel Ln
- 46 Hemlock Dr
- 15 Hazen St
- 6 Old Coach Rd
- 495 Winthrop Rd
- 493 Winthrop Rd
- 497 Winthrop Rd Unit 3
- 497 Winthrop Rd Unit 2
- 497 Winthrop Rd Unit 1
- 475 Winthrop Rd
- 23 Stevenstown Rd
- 29 Stevenstown Rd
- 463 Winthrop Rd
- 469 Winthrop Rd
- 19 Stevenstown Rd
- 519 Winthrop Rd
- 470 Winthrop Rd
- 486 Winthrop Rd
- 38 Stevenstown Rd
- 460 Winthrop Rd
- 453 Winthrop Rd
- 447 Winthrop Rd
- 537 Winthrop Rd
- 0 Cedar Lake Rd Unit 170012962
Your Personal Tour Guide
Ask me questions while you tour the home.