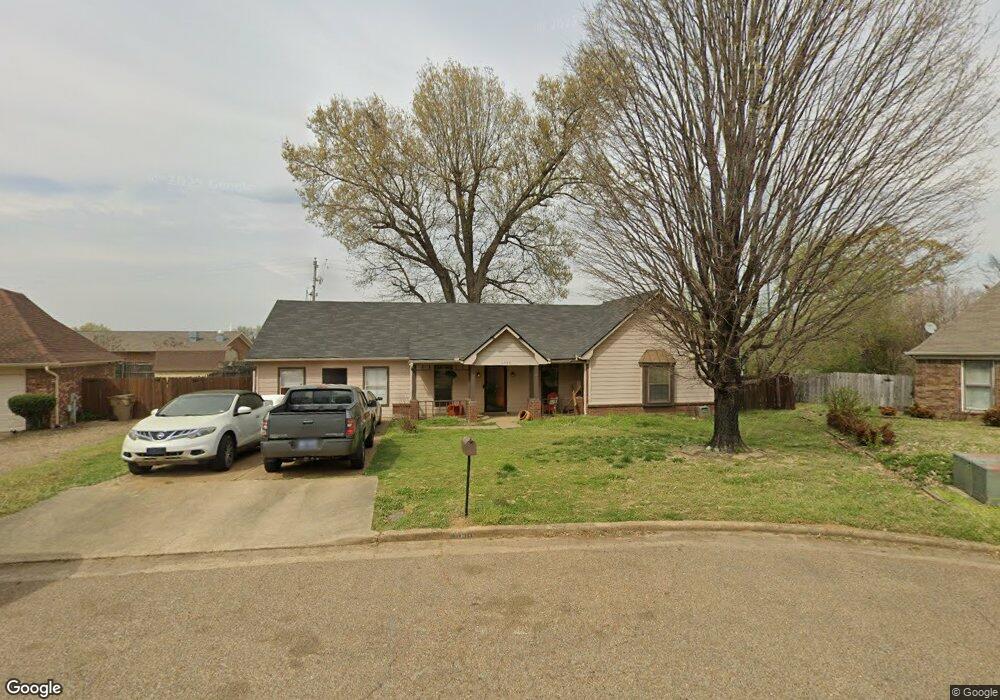
4950 Pheasant Ridge Cove Memphis, TN 38141
Hickory Hill NeighborhoodEstimated Value: $201,000 - $250,000
3
Beds
2
Baths
2,016
Sq Ft
$112/Sq Ft
Est. Value
About This Home
This home is located at 4950 Pheasant Ridge Cove, Memphis, TN 38141 and is currently estimated at $226,462, approximately $112 per square foot. 4950 Pheasant Ridge Cove is a home located in Shelby County with nearby schools including Highland Oaks Elementary School, Highland Oaks Middle School, and Southwind High School.
Ownership History
Date
Name
Owned For
Owner Type
Purchase Details
Closed on
Dec 3, 2007
Sold by
Spikner Dorothy L
Bought by
Treadwell Charmell C
Current Estimated Value
Purchase Details
Closed on
Aug 30, 2001
Sold by
Lasalle Bank National Assn
Bought by
Spikner Dorothy
Home Financials for this Owner
Home Financials are based on the most recent Mortgage that was taken out on this home.
Original Mortgage
$84,750
Interest Rate
7.02%
Purchase Details
Closed on
May 9, 2001
Sold by
Richmond Morgan R
Bought by
Lasalle National Bank
Purchase Details
Closed on
Jun 30, 1998
Sold by
Rogers Jack M and Rogers Tina
Bought by
Richmond Morgan R
Home Financials for this Owner
Home Financials are based on the most recent Mortgage that was taken out on this home.
Original Mortgage
$10,464
Interest Rate
6.97%
Mortgage Type
Seller Take Back
Create a Home Valuation Report for This Property
The Home Valuation Report is an in-depth analysis detailing your home's value as well as a comparison with similar homes in the area
Home Values in the Area
Average Home Value in this Area
Purchase History
| Date | Buyer | Sale Price | Title Company |
|---|---|---|---|
| Treadwell Charmell C | -- | None Available | |
| Spikner Dorothy | $85,000 | -- | |
| Lasalle National Bank | $92,700 | -- | |
| Richmond Morgan R | $95,000 | -- |
Source: Public Records
Mortgage History
| Date | Status | Borrower | Loan Amount |
|---|---|---|---|
| Previous Owner | Spikner Dorothy | $84,750 | |
| Previous Owner | Richmond Morgan R | $10,464 |
Source: Public Records
Tax History Compared to Growth
Tax History
| Year | Tax Paid | Tax Assessment Tax Assessment Total Assessment is a certain percentage of the fair market value that is determined by local assessors to be the total taxable value of land and additions on the property. | Land | Improvement |
|---|---|---|---|---|
| 2025 | $1,481 | $62,275 | $12,025 | $50,250 |
| 2024 | $1,481 | $43,700 | $6,225 | $37,475 |
| 2023 | $1,481 | $43,700 | $6,225 | $37,475 |
| 2022 | $1,481 | $43,700 | $6,225 | $37,475 |
| 2021 | $1,508 | $43,700 | $6,225 | $37,475 |
| 2020 | $1,350 | $33,325 | $6,225 | $27,100 |
| 2019 | $1,350 | $33,325 | $6,225 | $27,100 |
| 2018 | $1,350 | $33,325 | $6,225 | $27,100 |
| 2017 | $1,370 | $33,325 | $6,225 | $27,100 |
| 2016 | $1,087 | $24,875 | $0 | $0 |
| 2014 | $1,087 | $24,875 | $0 | $0 |
Source: Public Records
Map
Nearby Homes
- 4935 Woodberry Cove
- 6941 Bennington Cir
- 4868 Water Fowl Ln
- 6732 Henredon Dr
- 6623 Cherry Bark Dr
- 6788 Burlingame Dr
- 6716 Shoreline Cir
- 6770 Shoreline Cir
- 6744 Shoreline Cir
- 4821 Blue Wing St
- 5265 Crystal Oak Dr
- 7125 Farmhouse Dr
- 5084 Autumn Morning Ln
- 5178 Autumn Morning Cove
- 6842 Rockbrook Dr
- 6623 Quail Covey Dr
- 5100 Sunny Autumn Ln
- 5340 Shady Ridge Cove
- 4927 Bradfield Run
- 4529 Quail Ridge Trail
- 4954 Pheasant Ridge Cove
- 4953 Pheasant Ridge Cove
- 4958 Pheasant Ridge Cove
- 4957 Pheasant Ridge Cove
- 4964 Pheasant Ridge Cove
- 4967 Pheasant Ridge Cove
- 4972 Pheasant Ridge Cove
- 6734 Pheasant Place Cove
- 6730 Pheasant Place Cove
- 4977 Pheasant Ridge Cove
- 4976 Pheasant Ridge Cove
- 6731 Pheasant Place Cove
- 6724 Pheasant Place Cove
- 5004 Pheasant Run Ln
- 4986 Pheasant Ridge Cove
- 5014 Pheasant Run Ln
- 6725 Pheasant Place Cove
- 5016 Pheasant Run Ln
- 5000 Pheasant Run Ln
- 6716 Pheasant Place Cove